Putnam Investments : Quarterly factsheet production

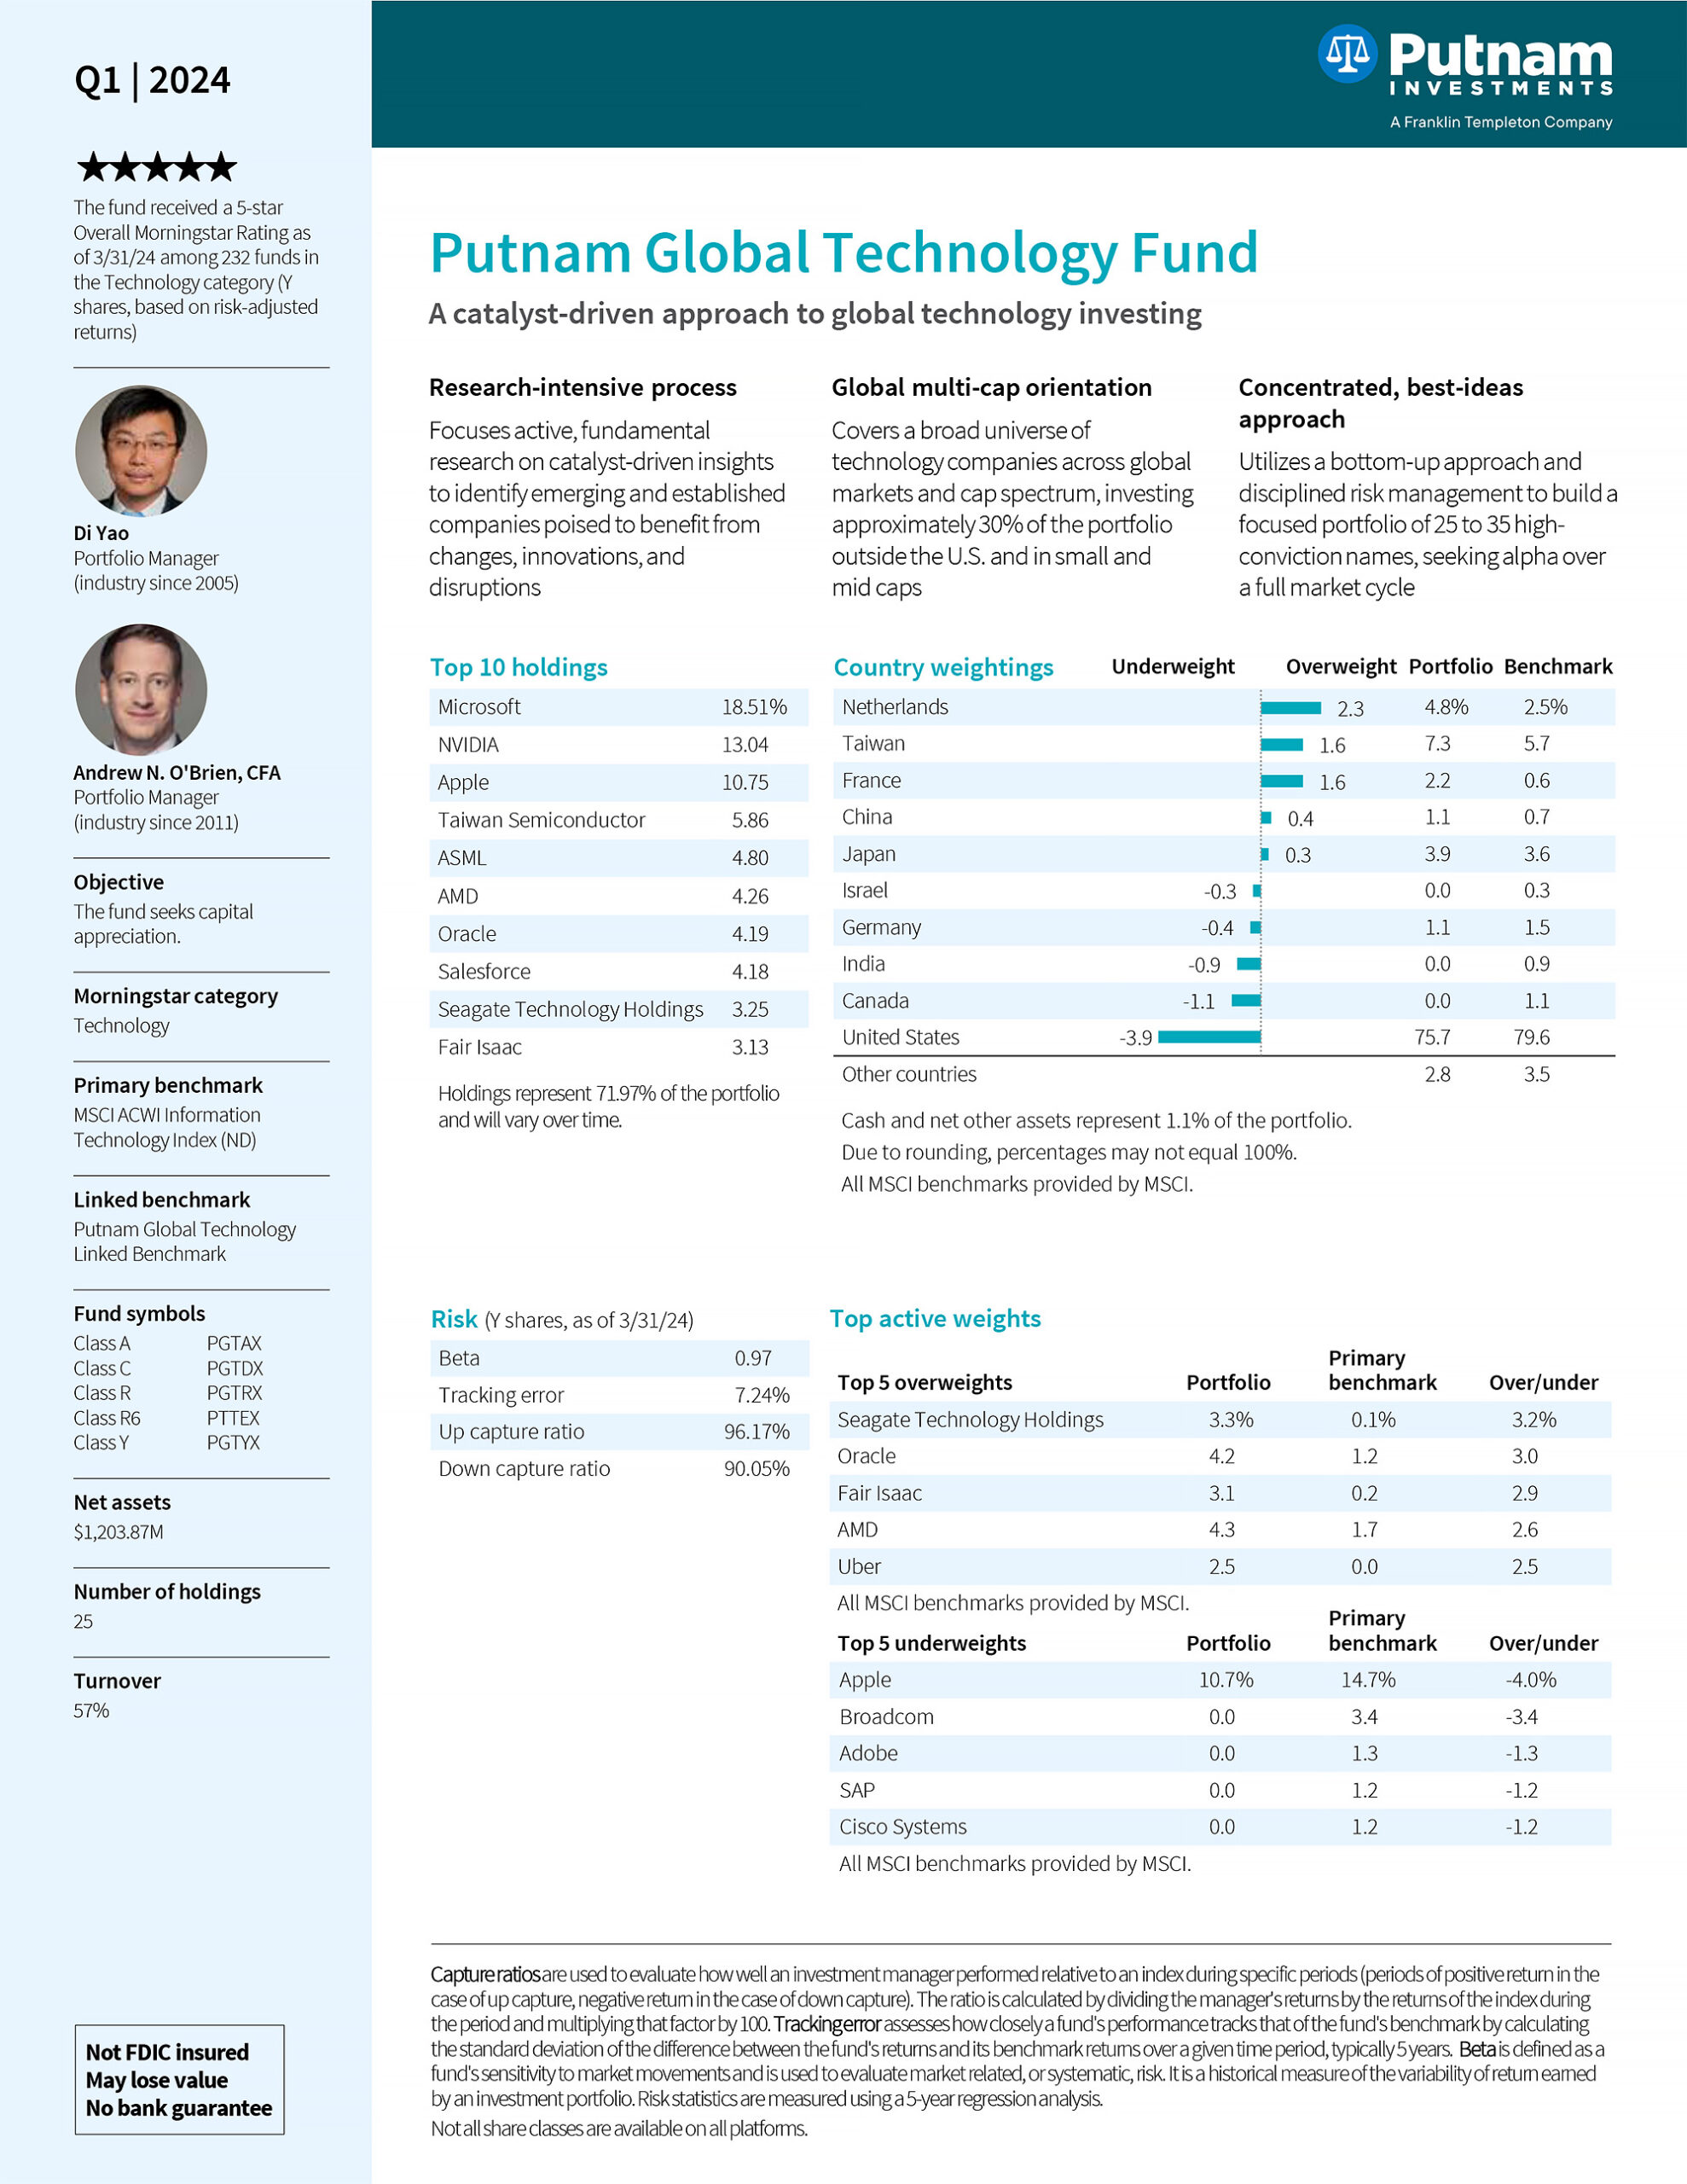
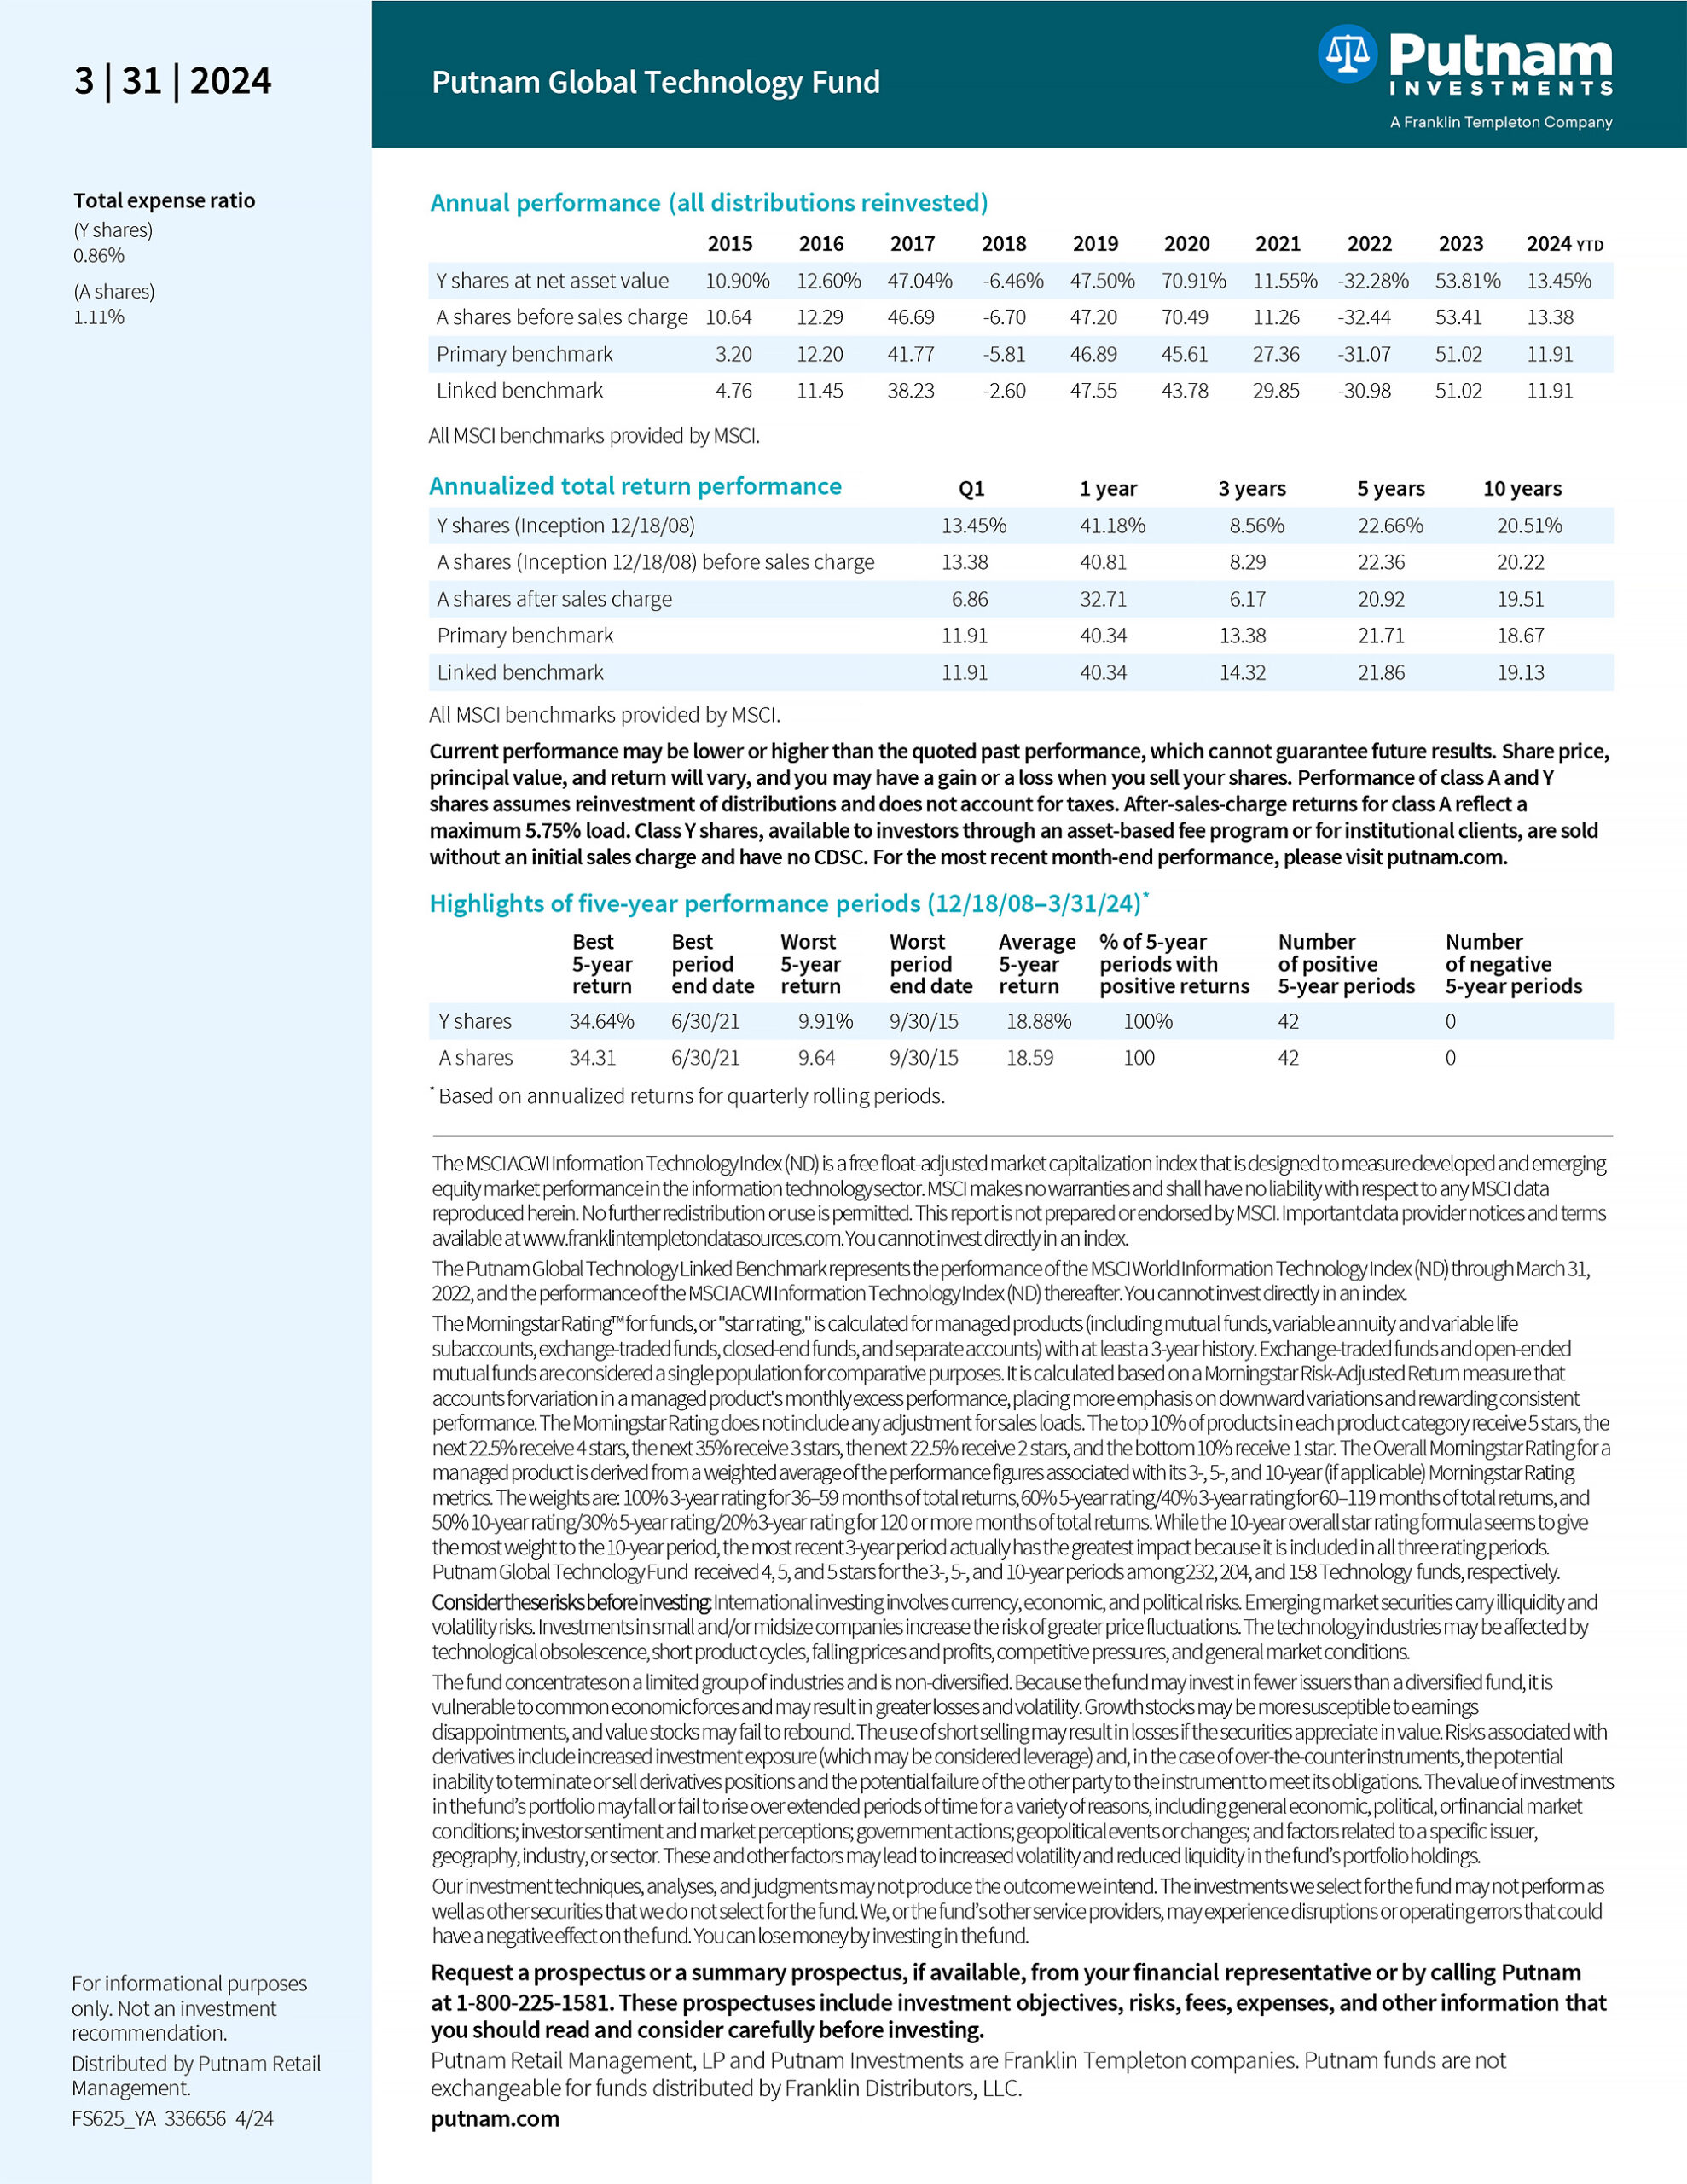
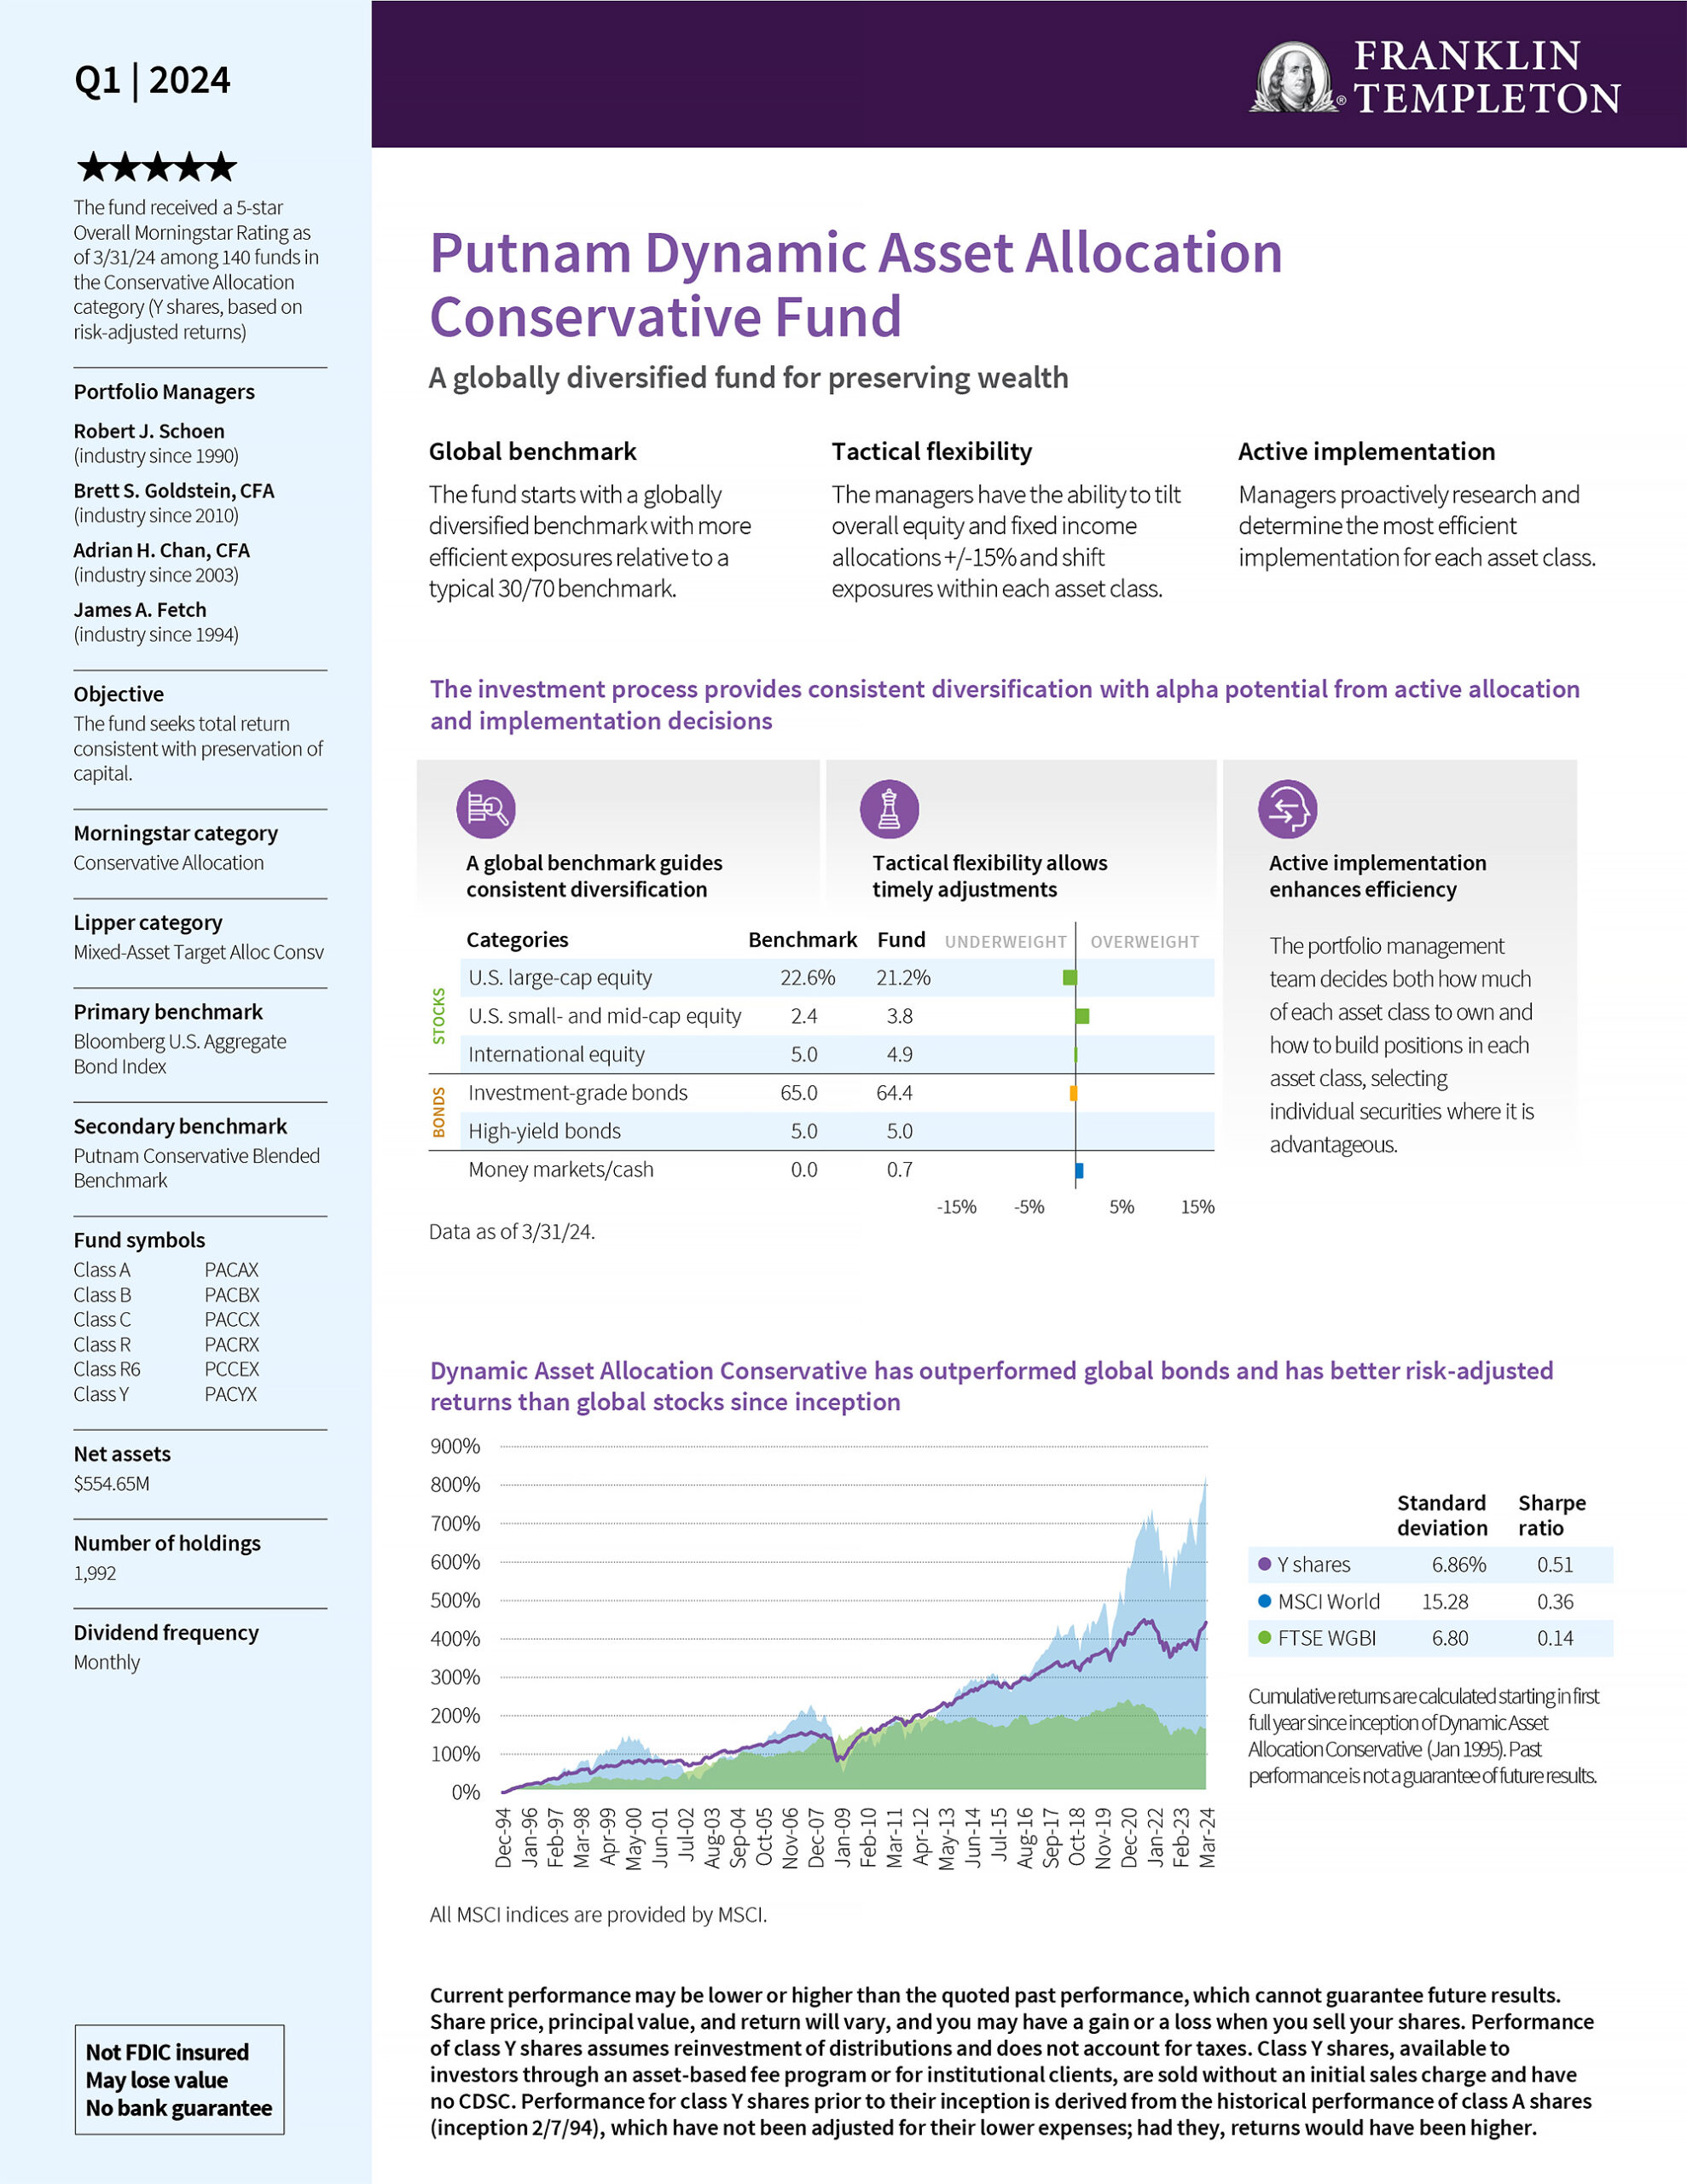
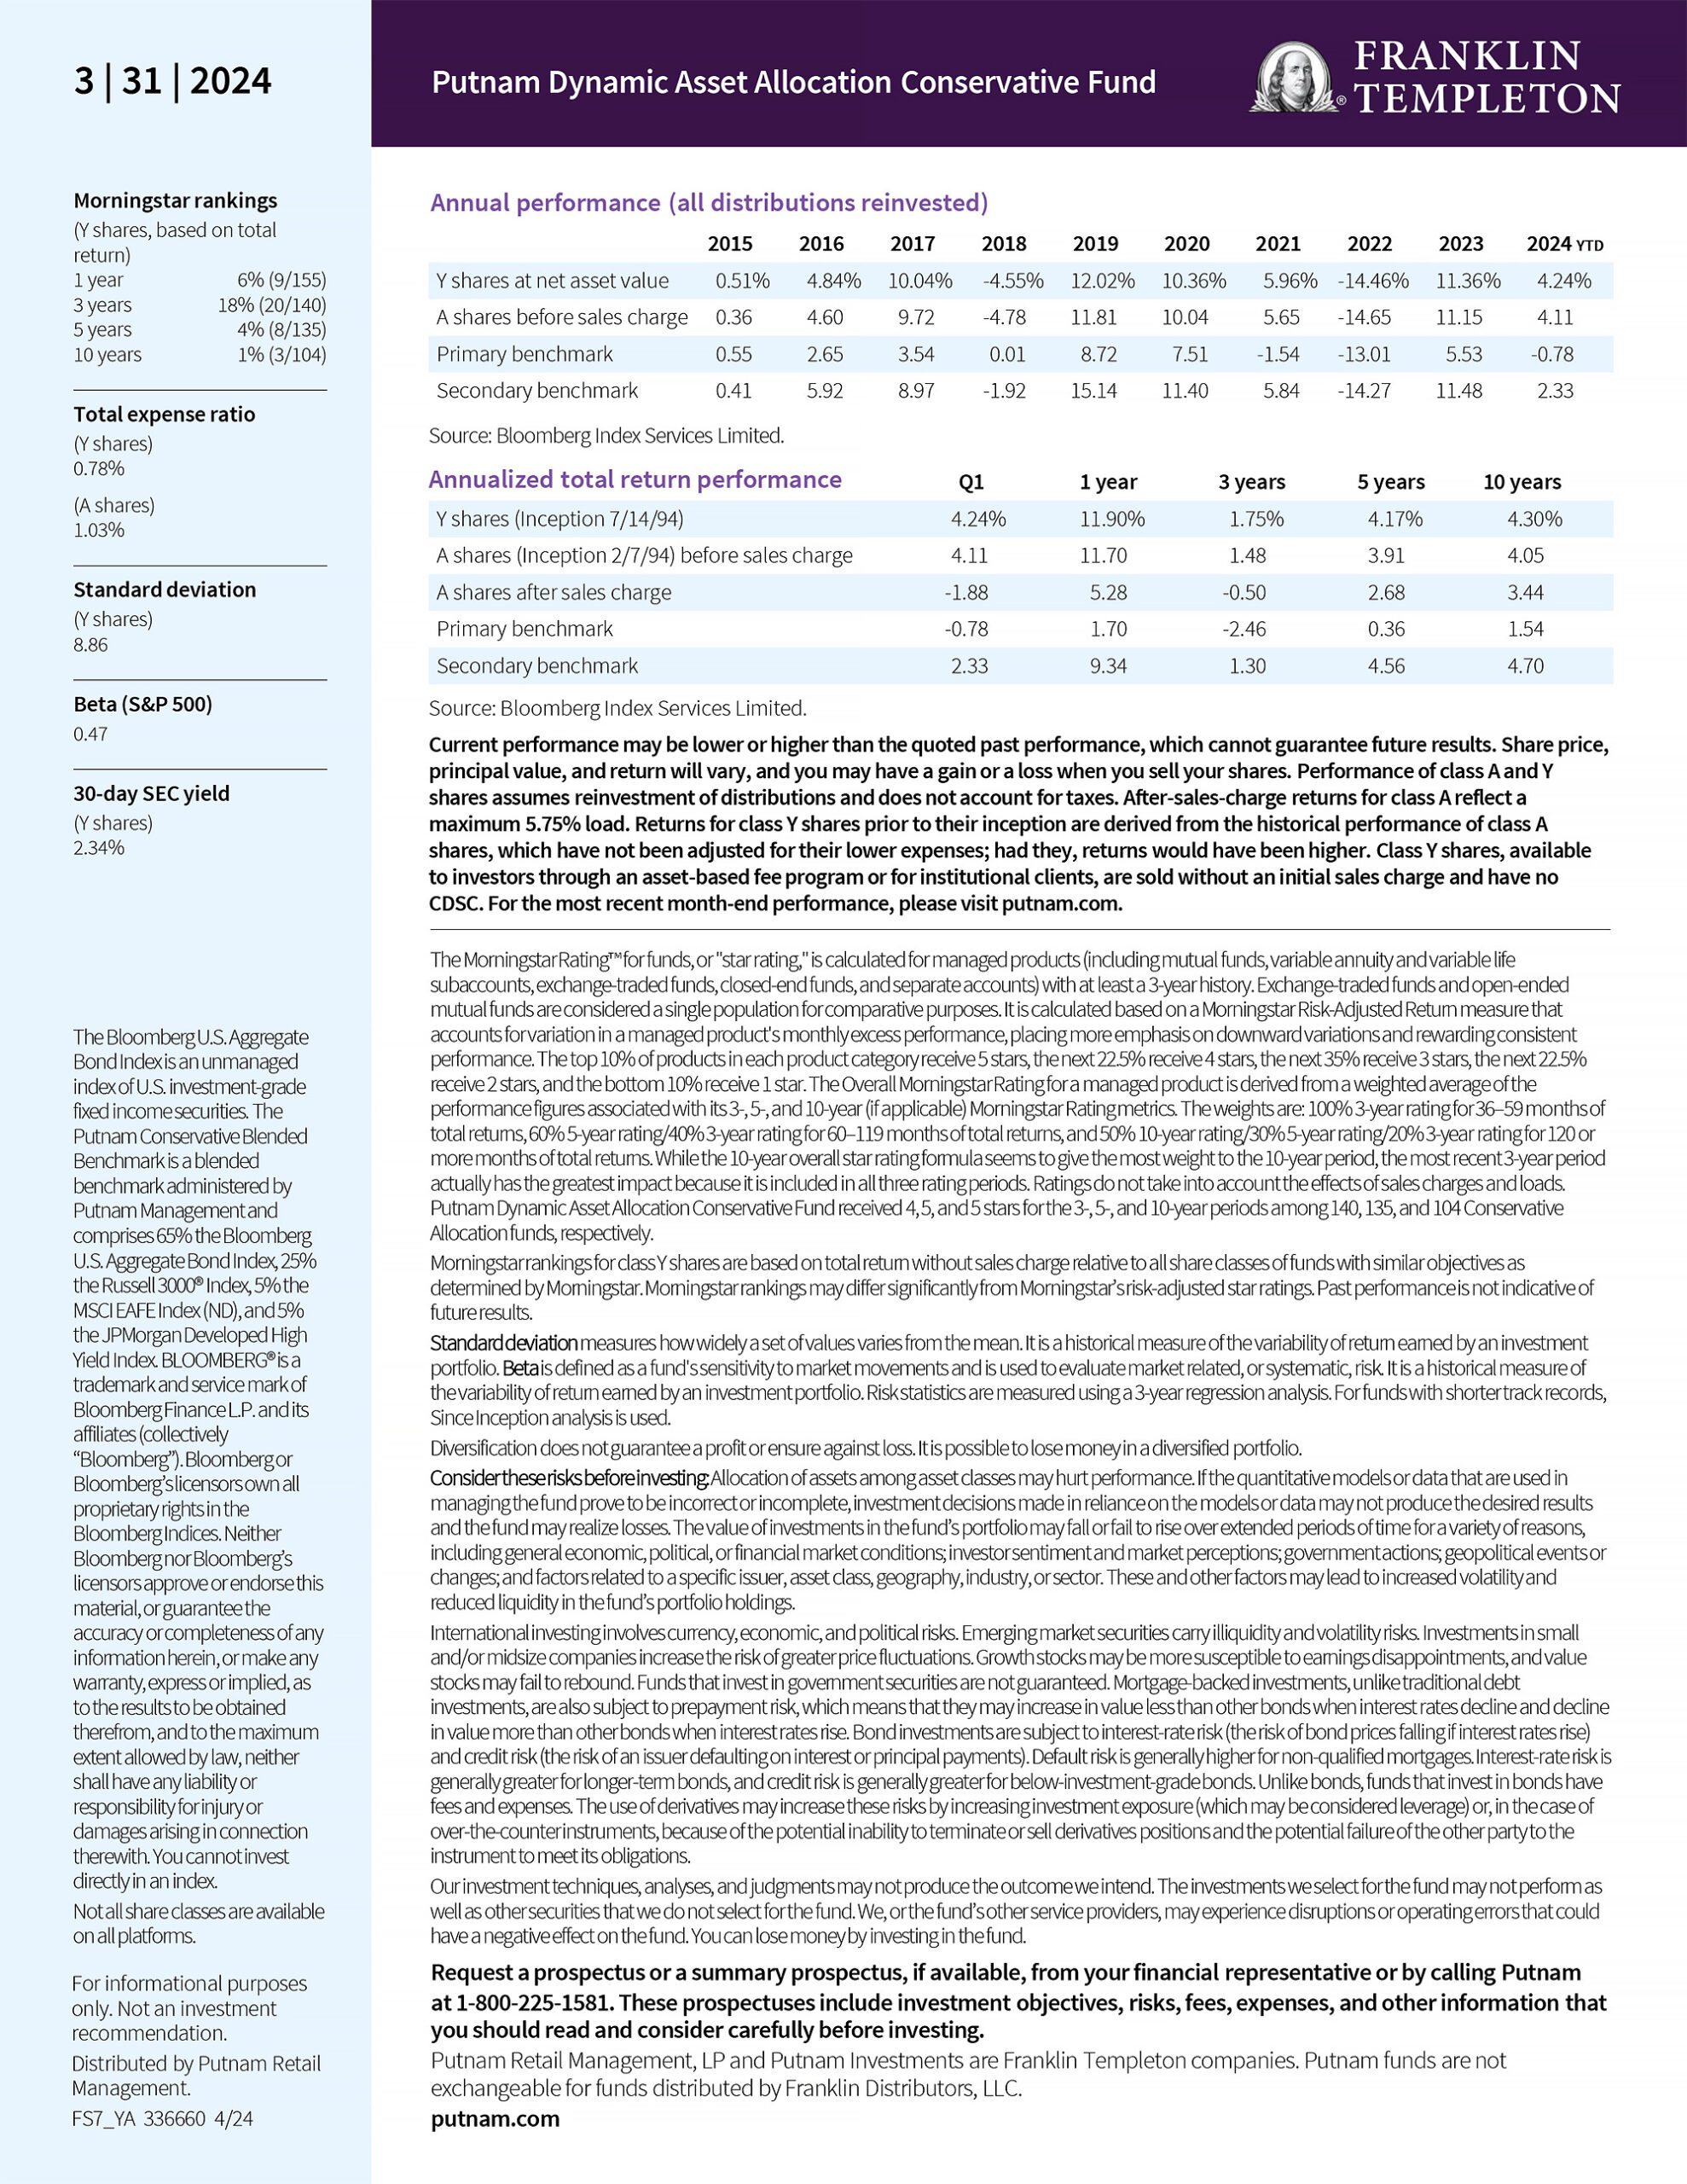
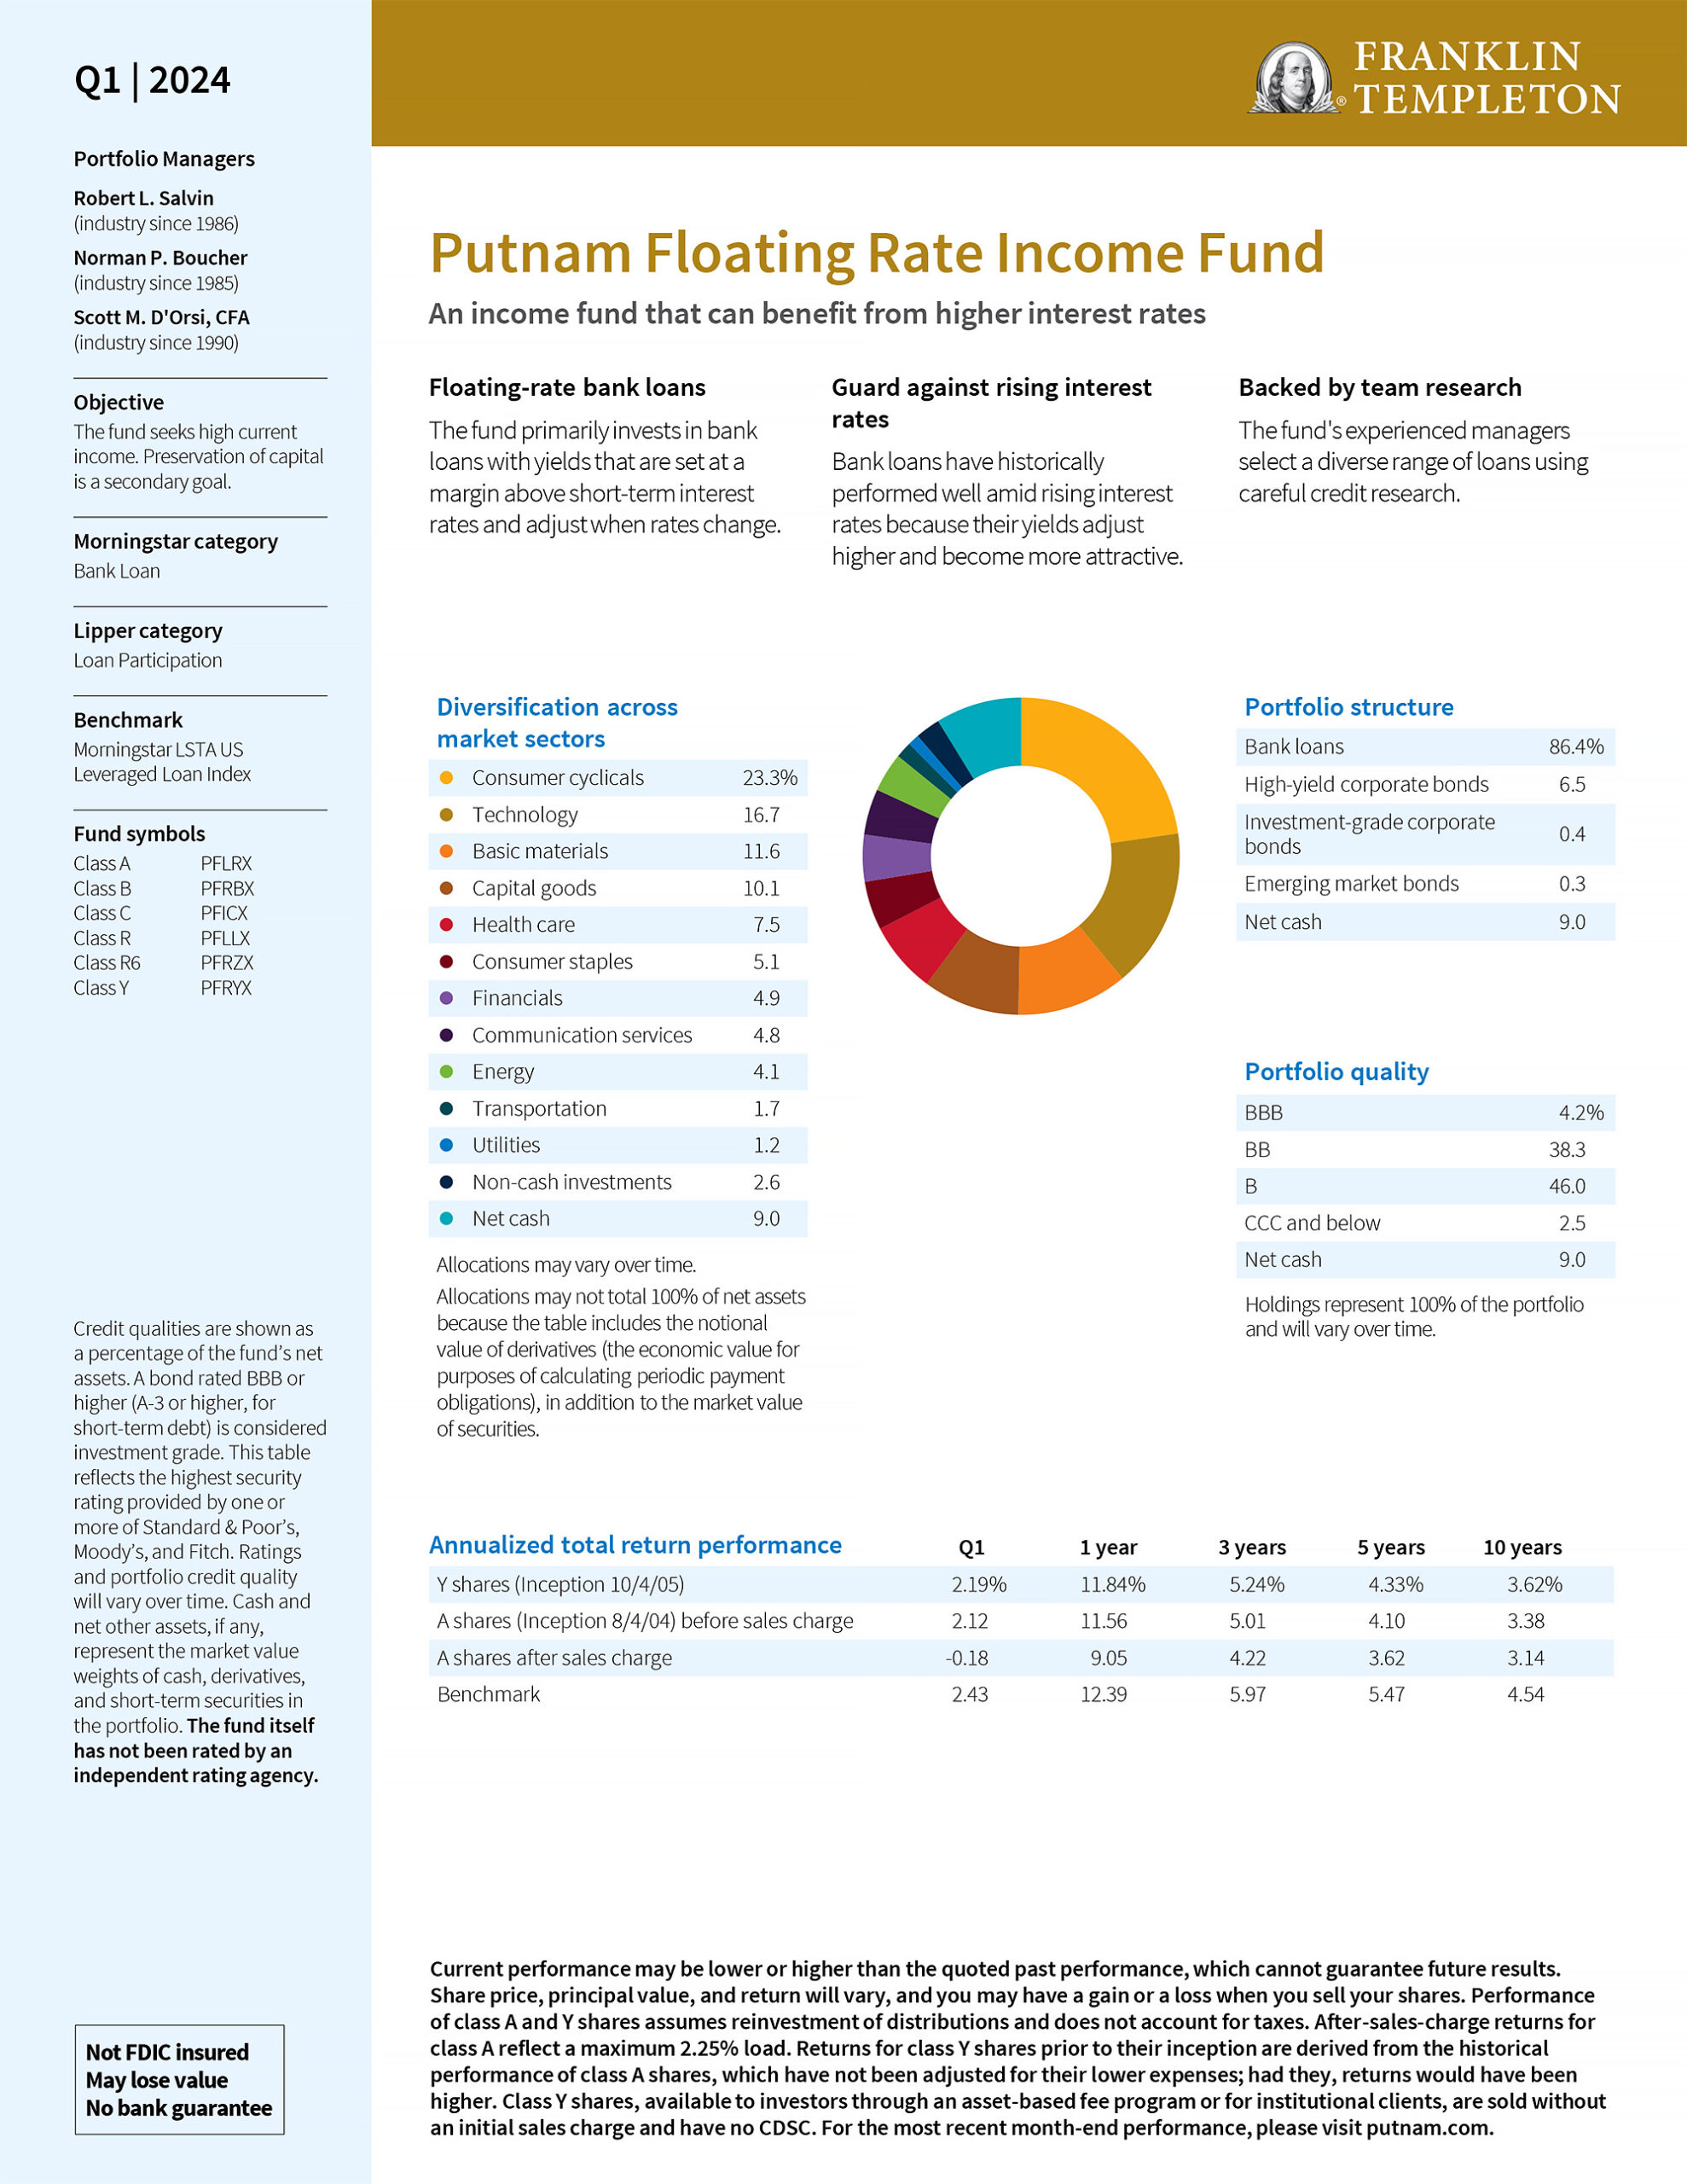
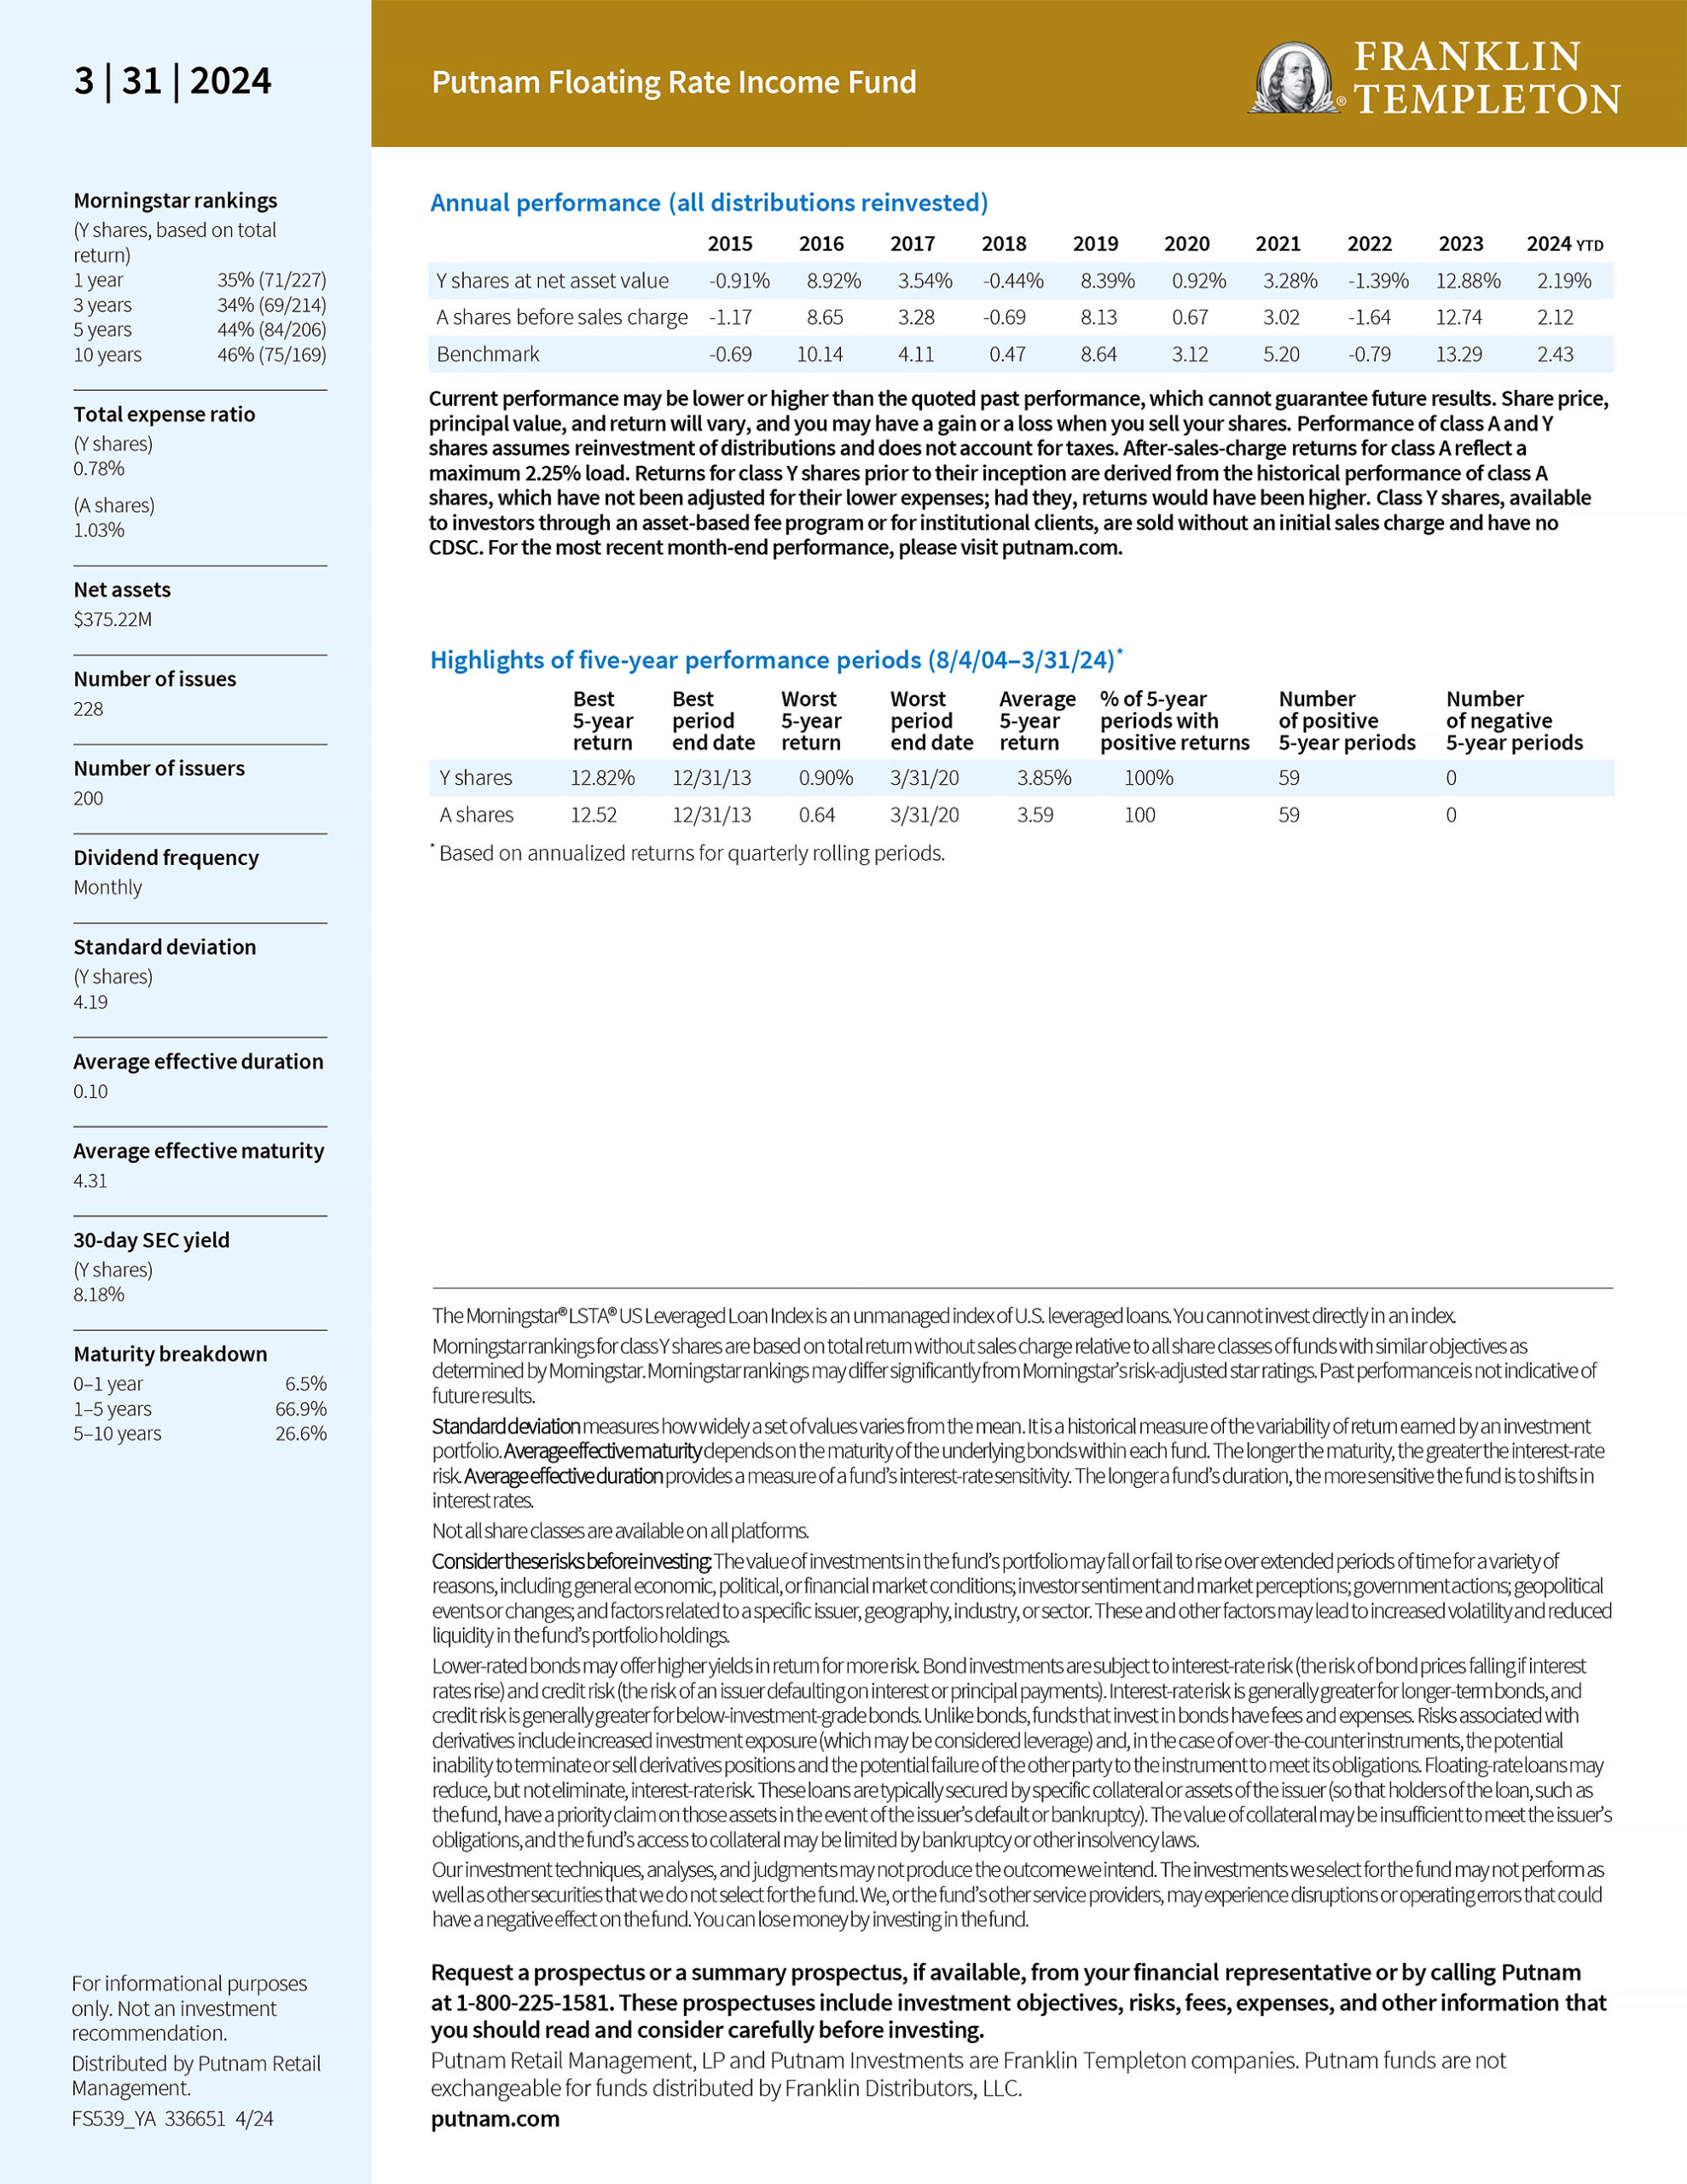
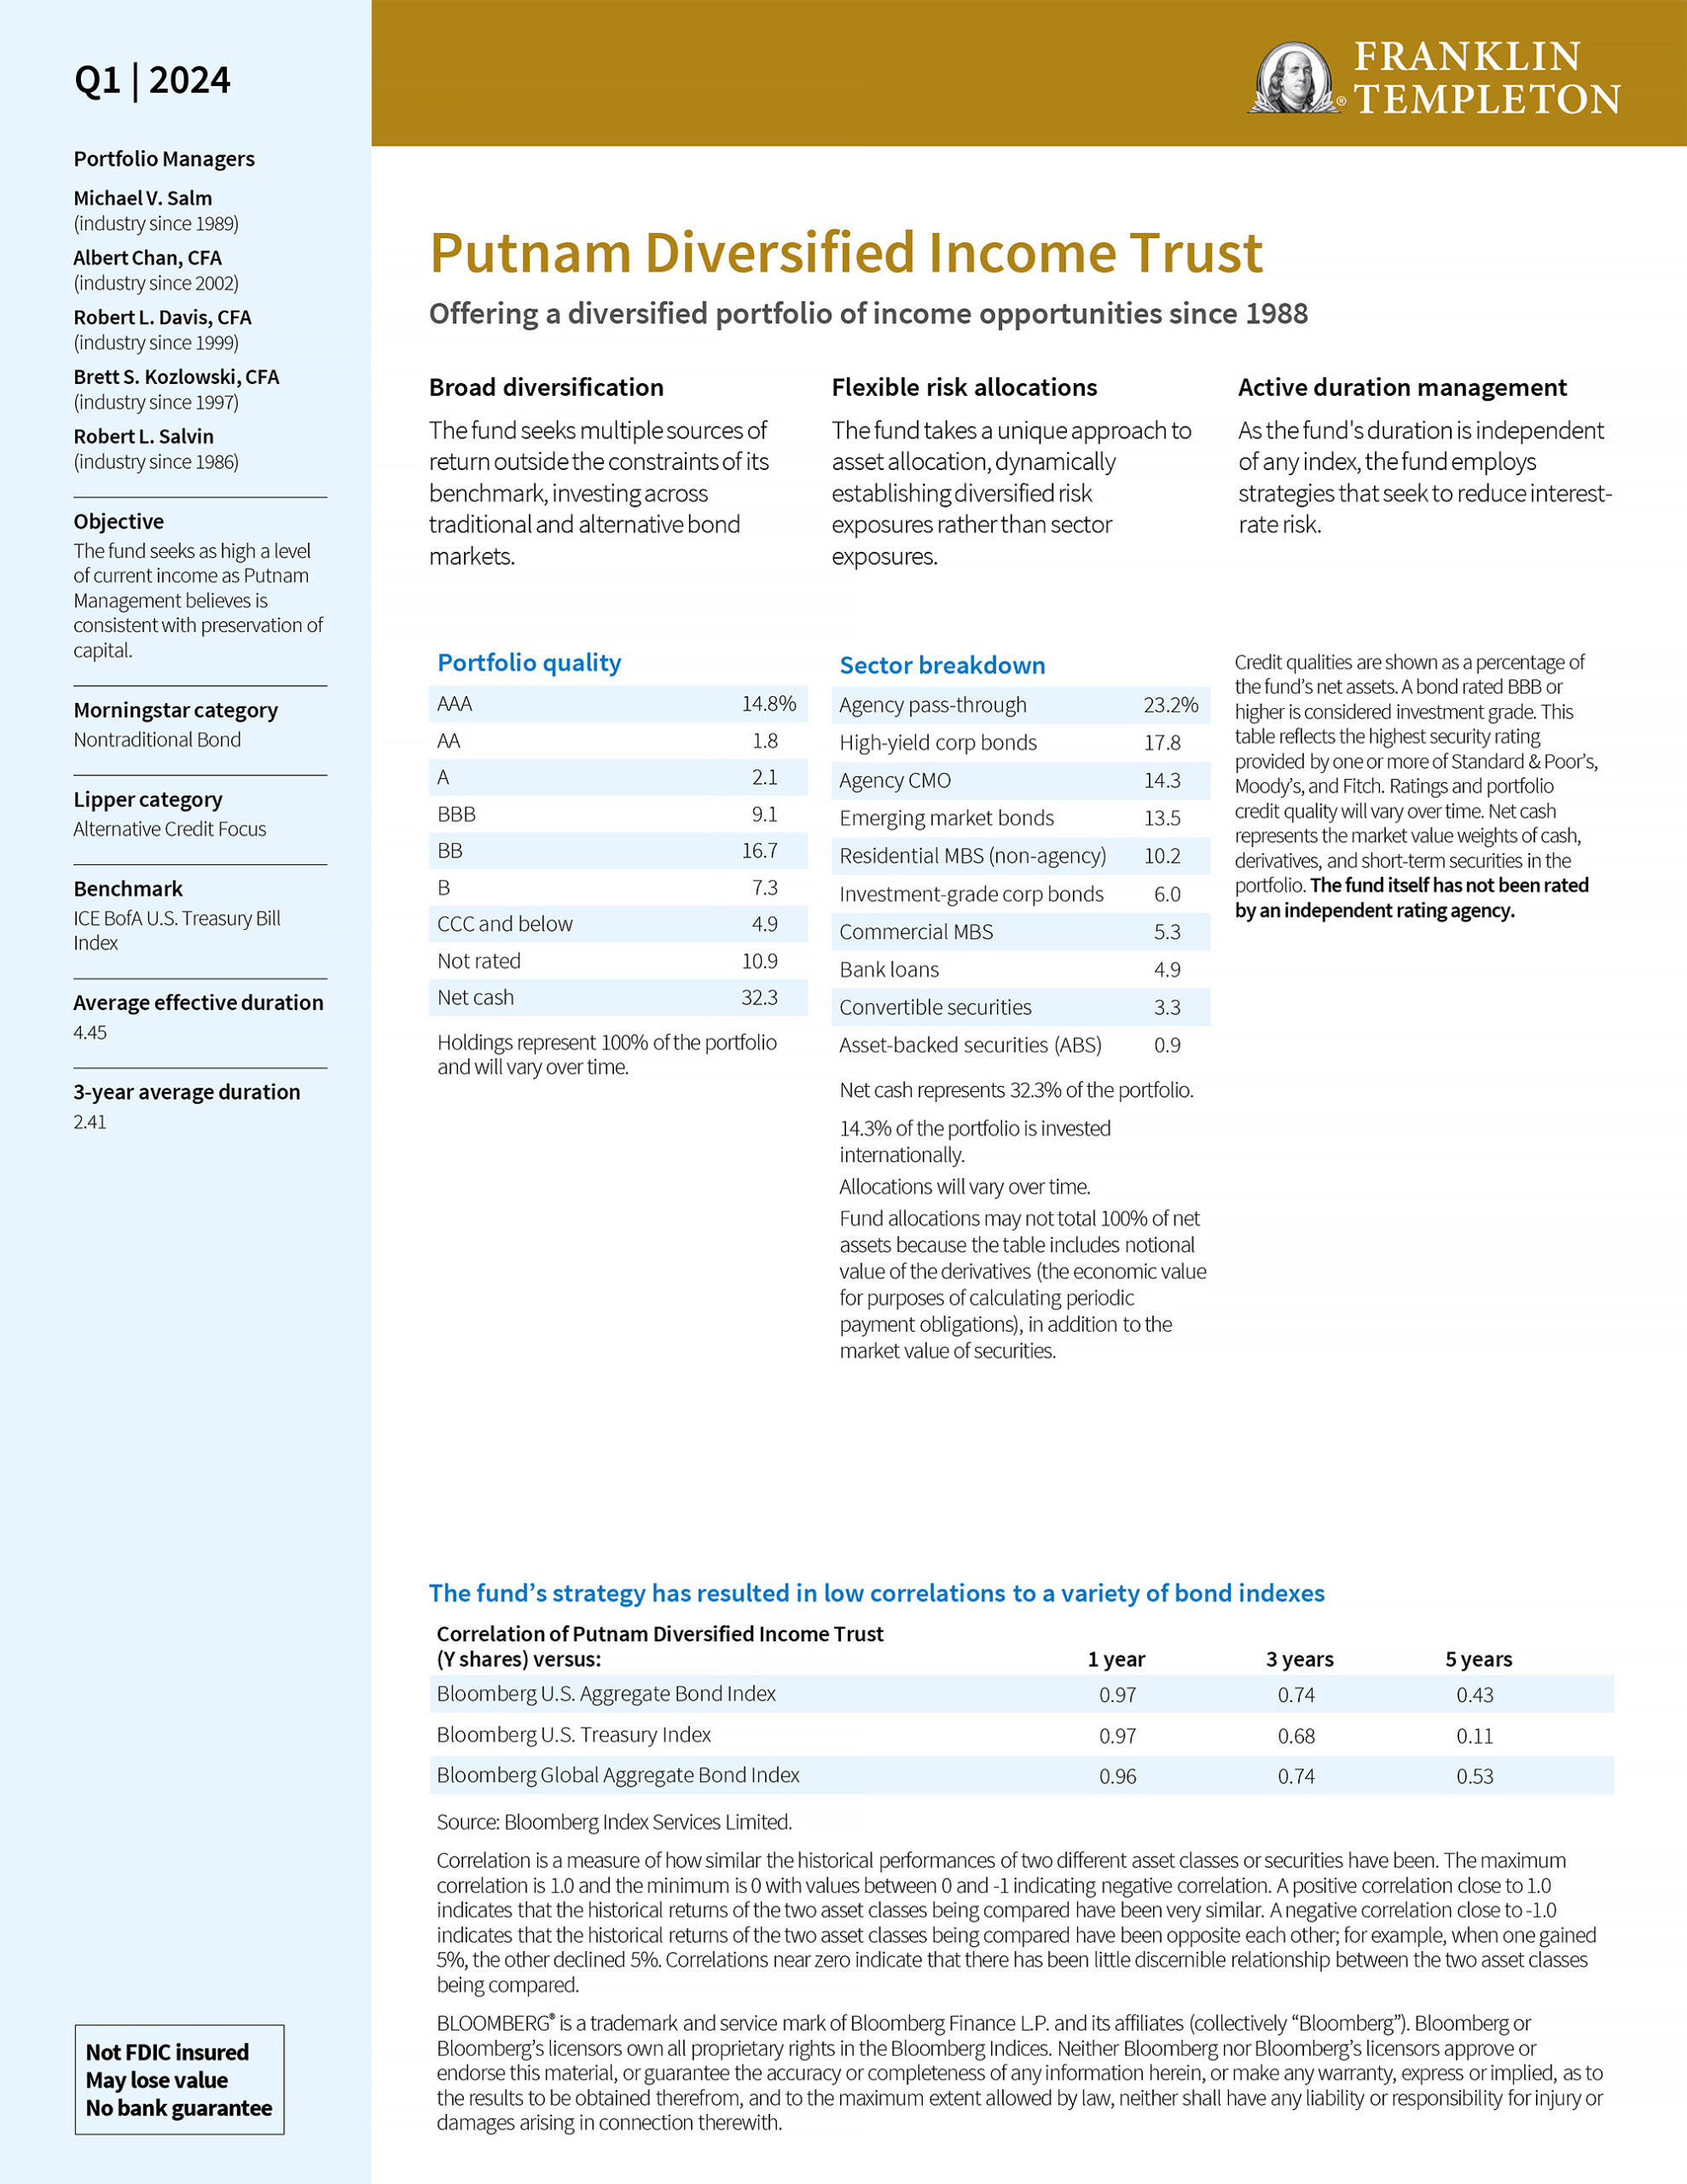
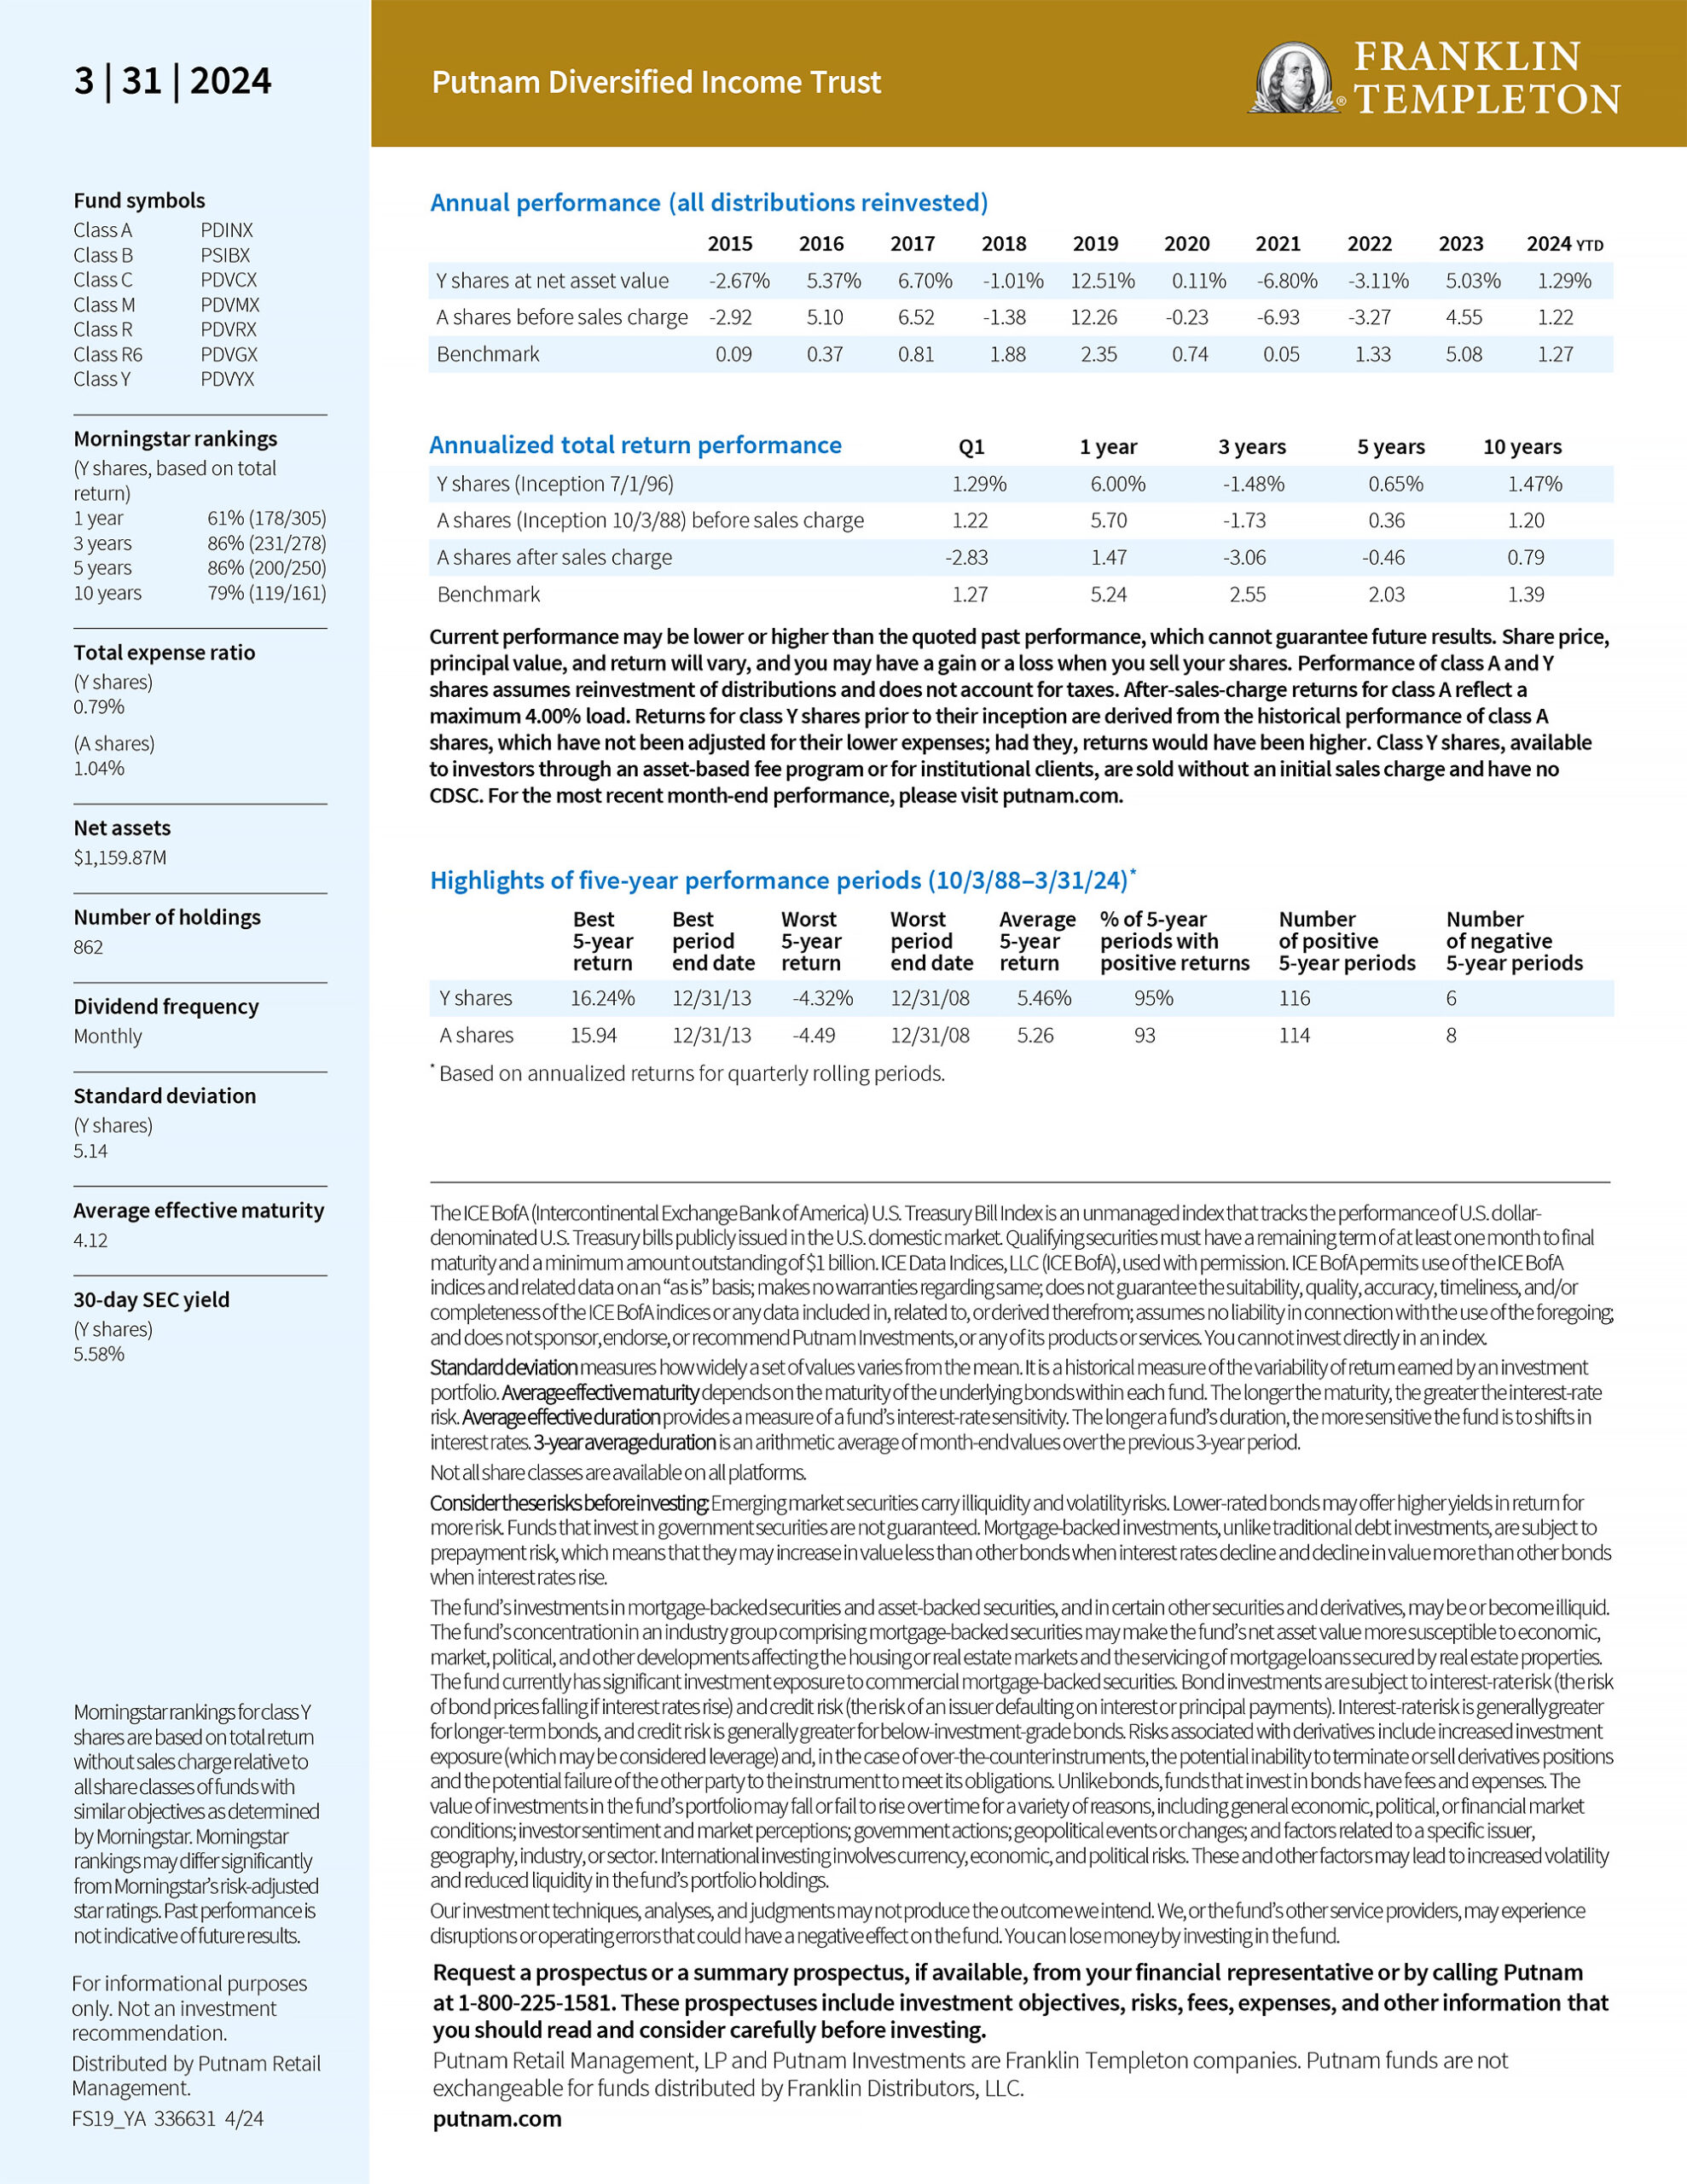
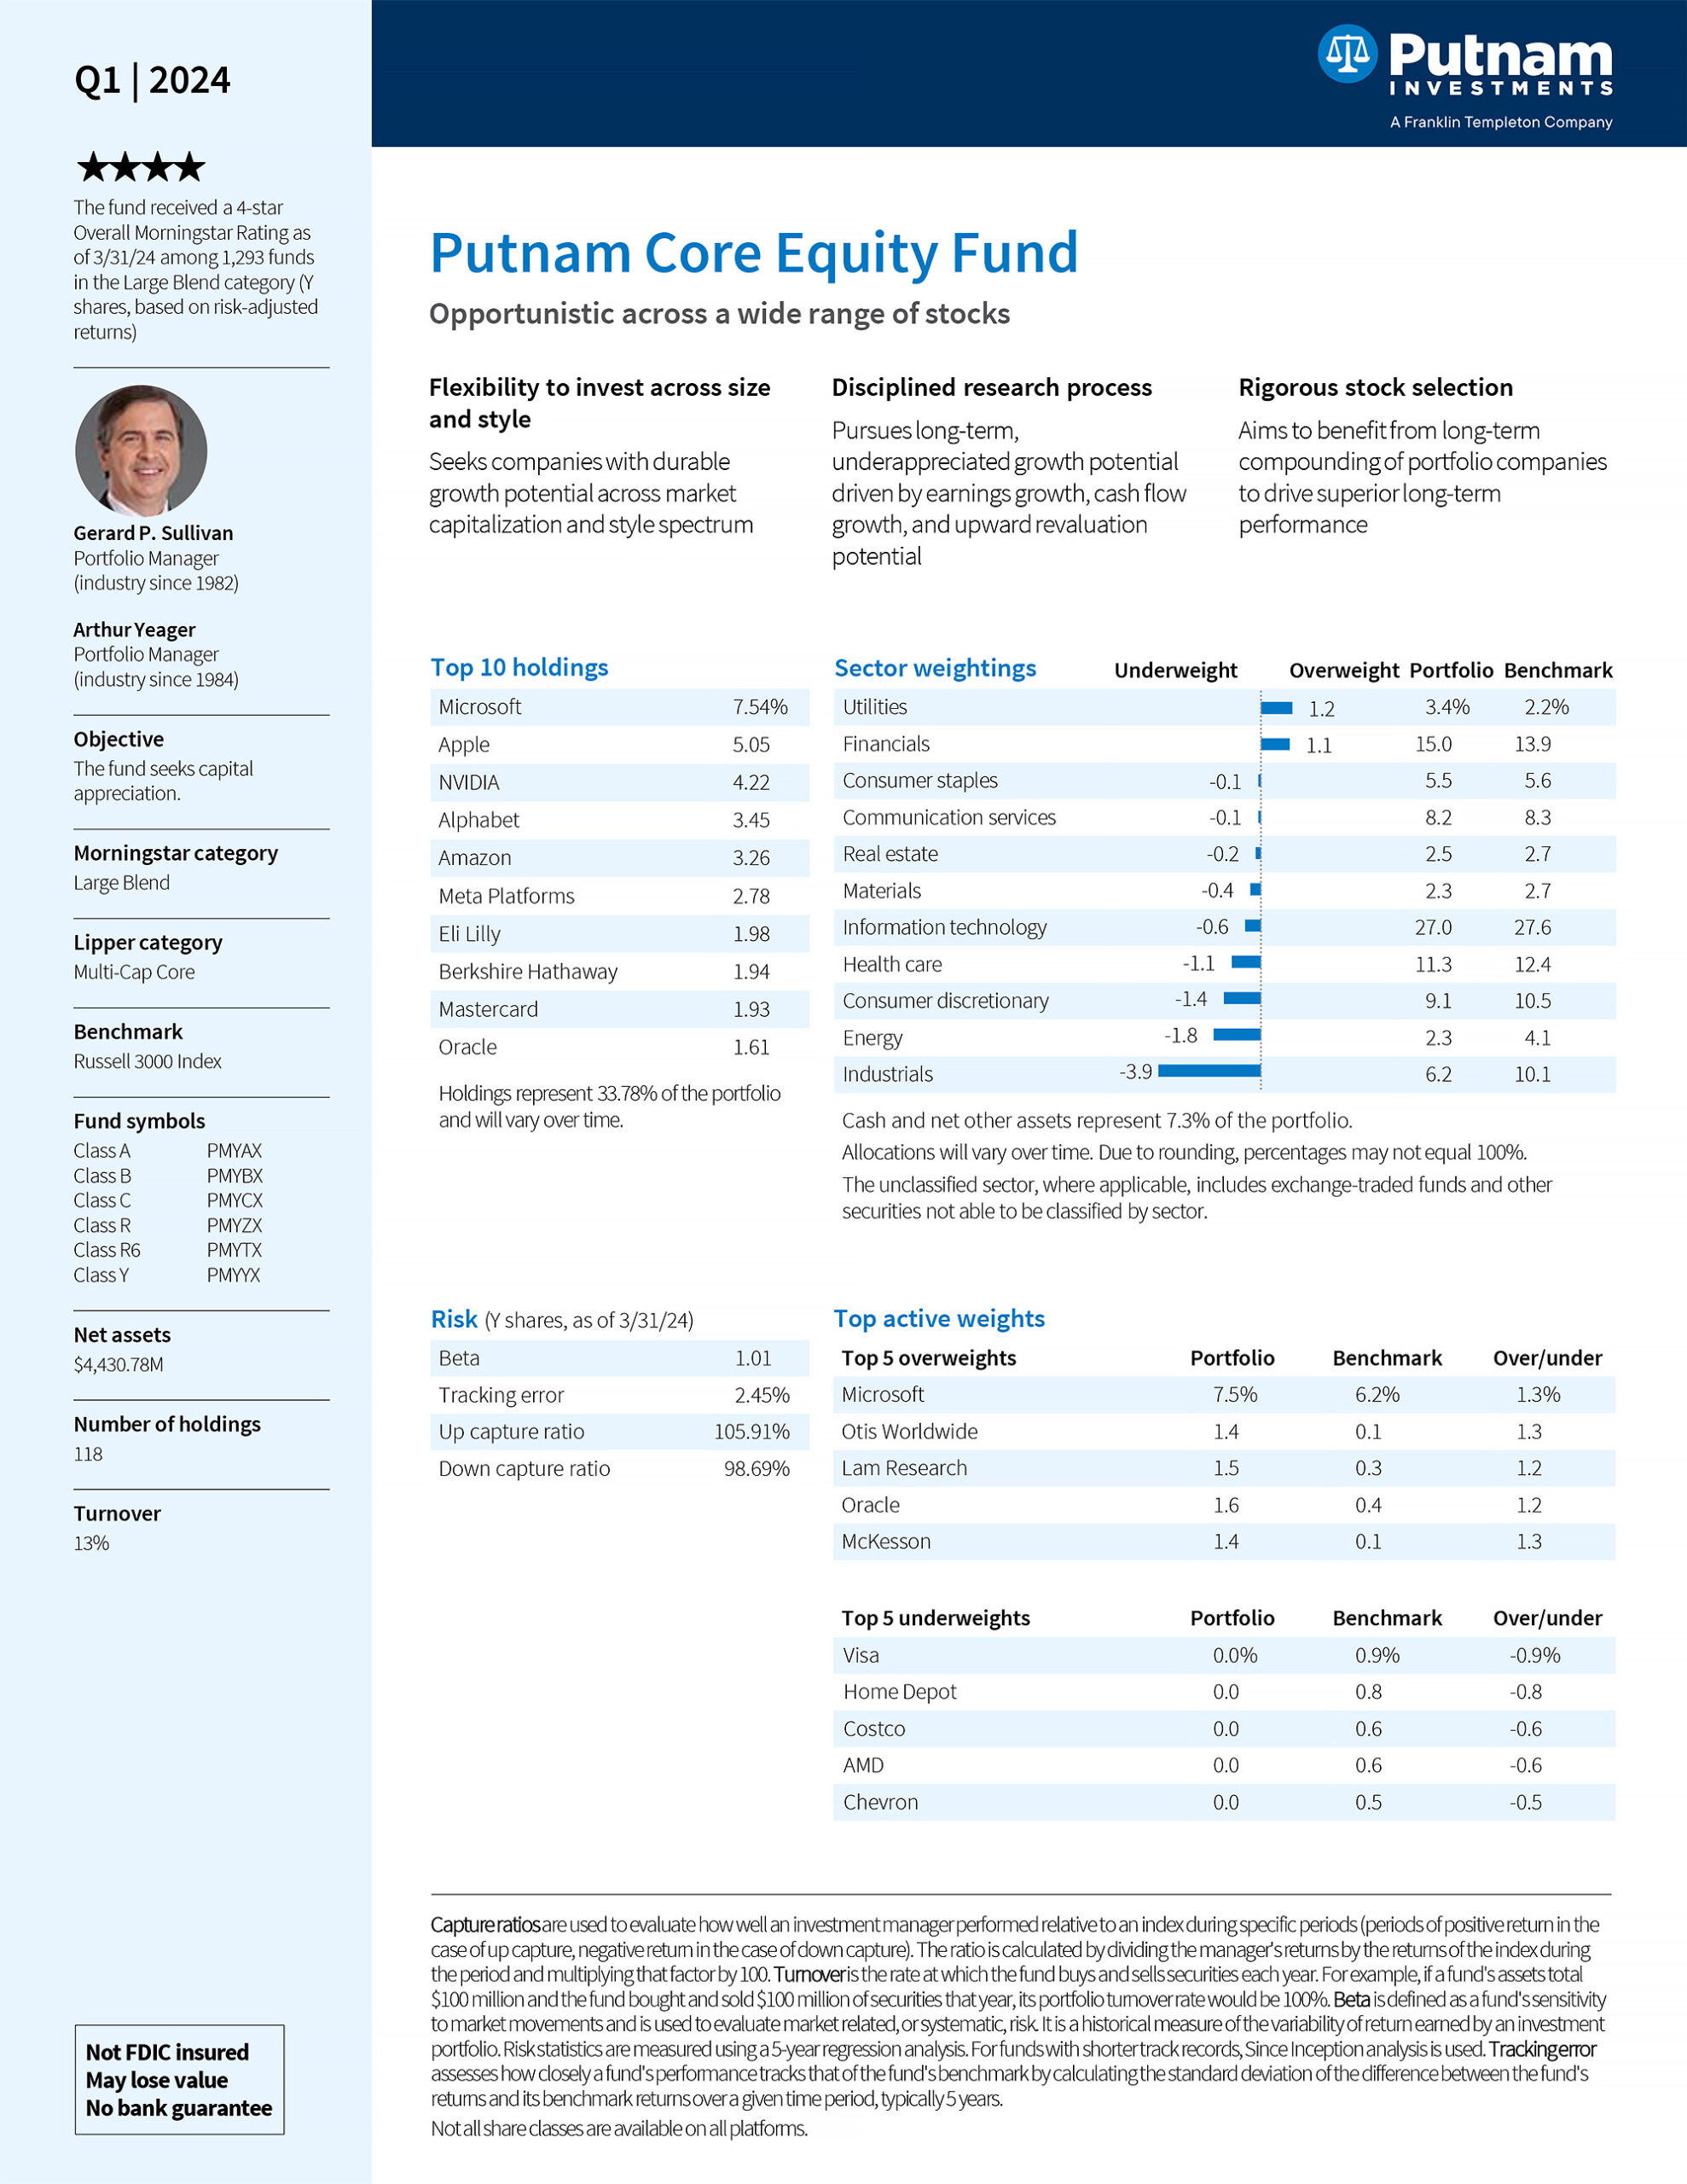
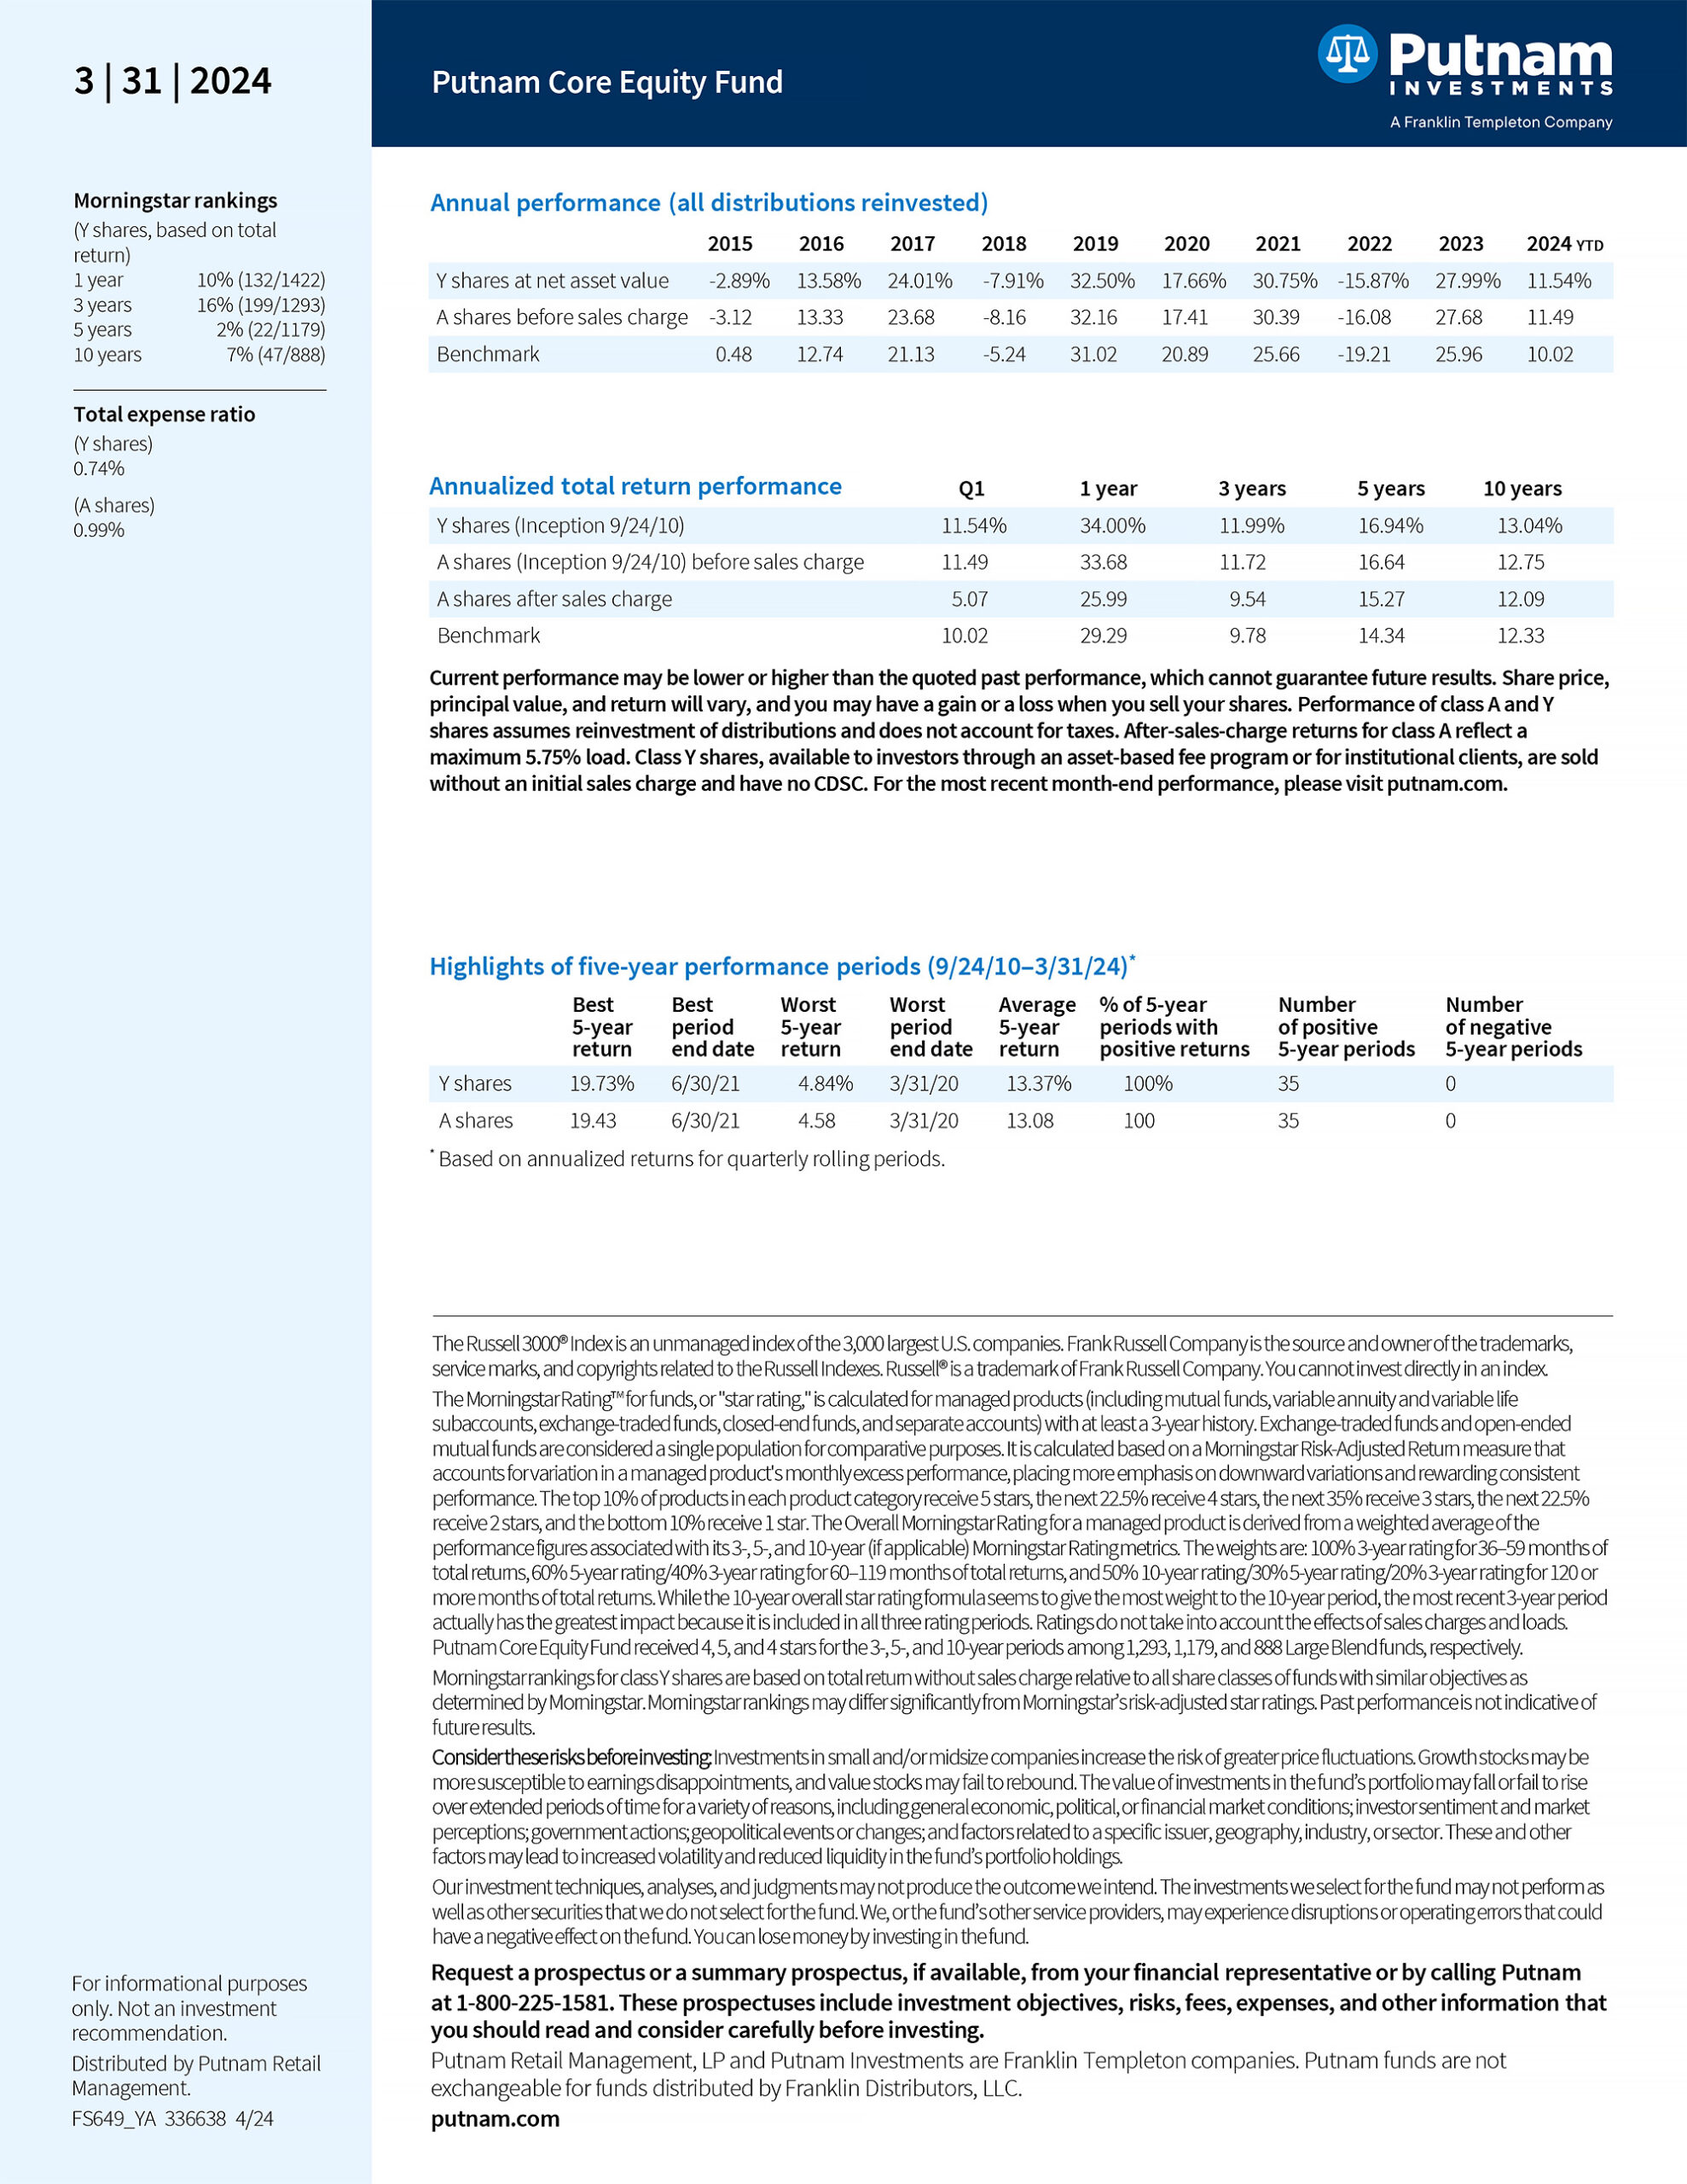
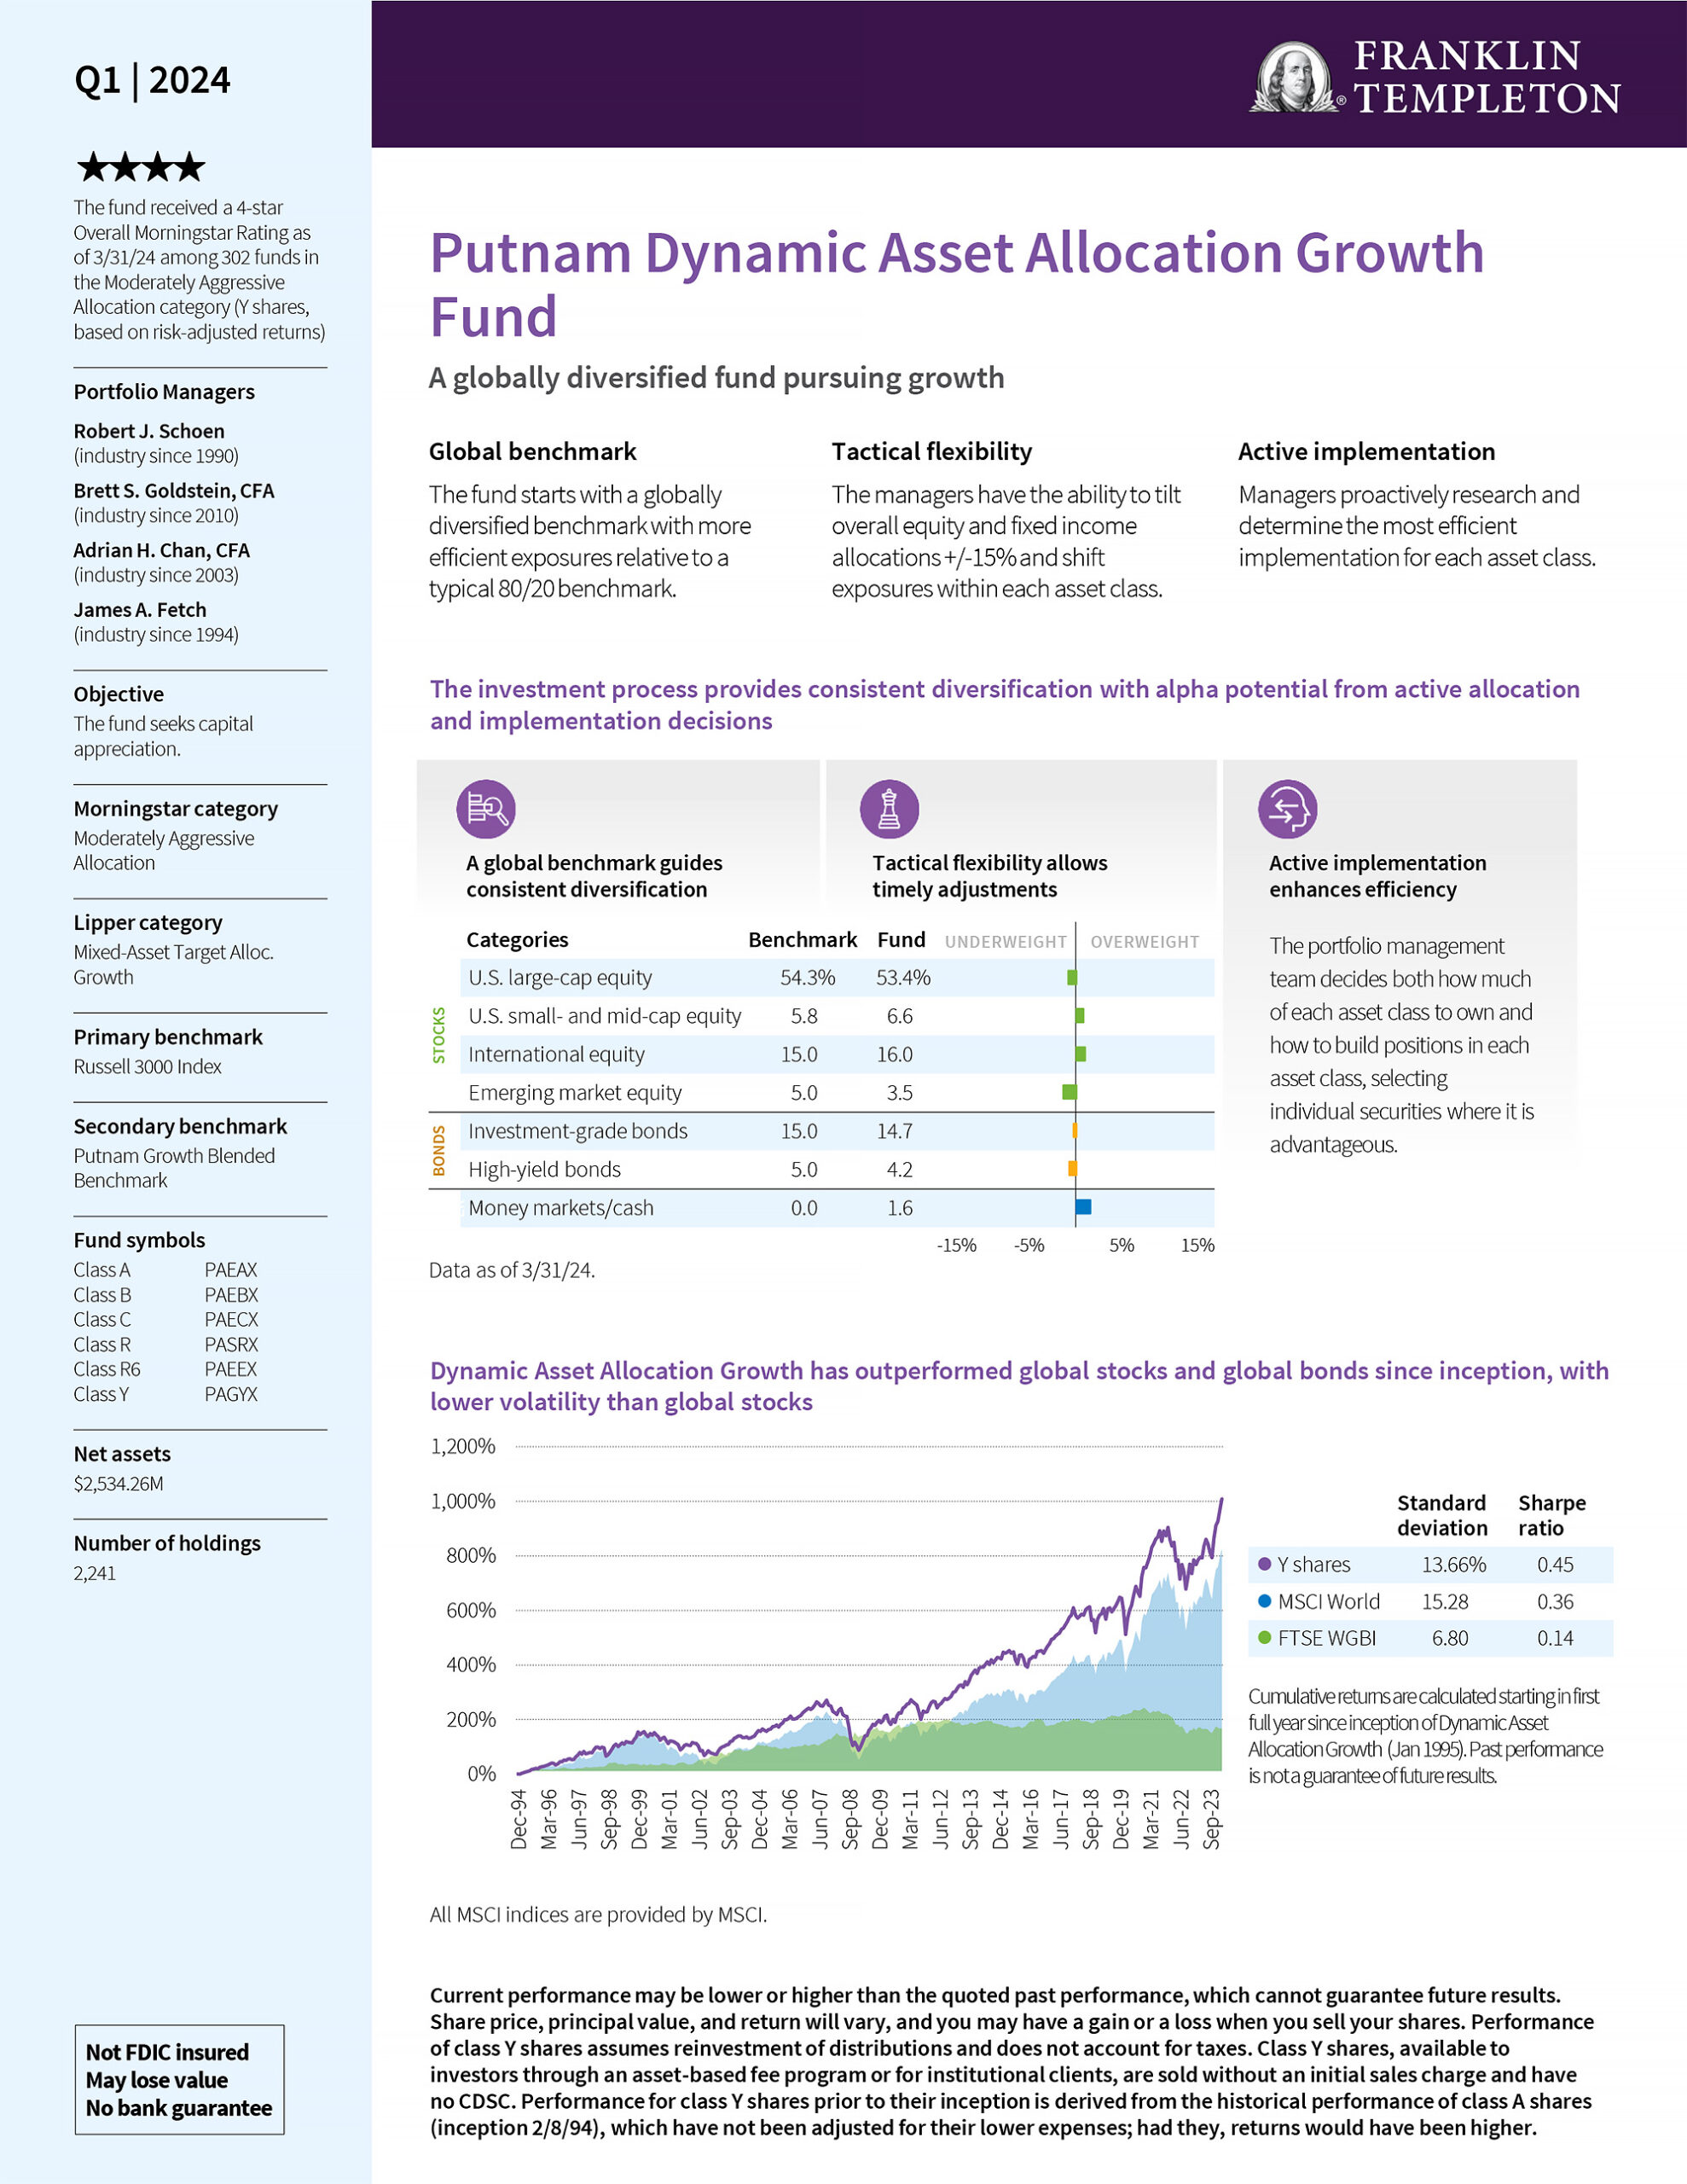
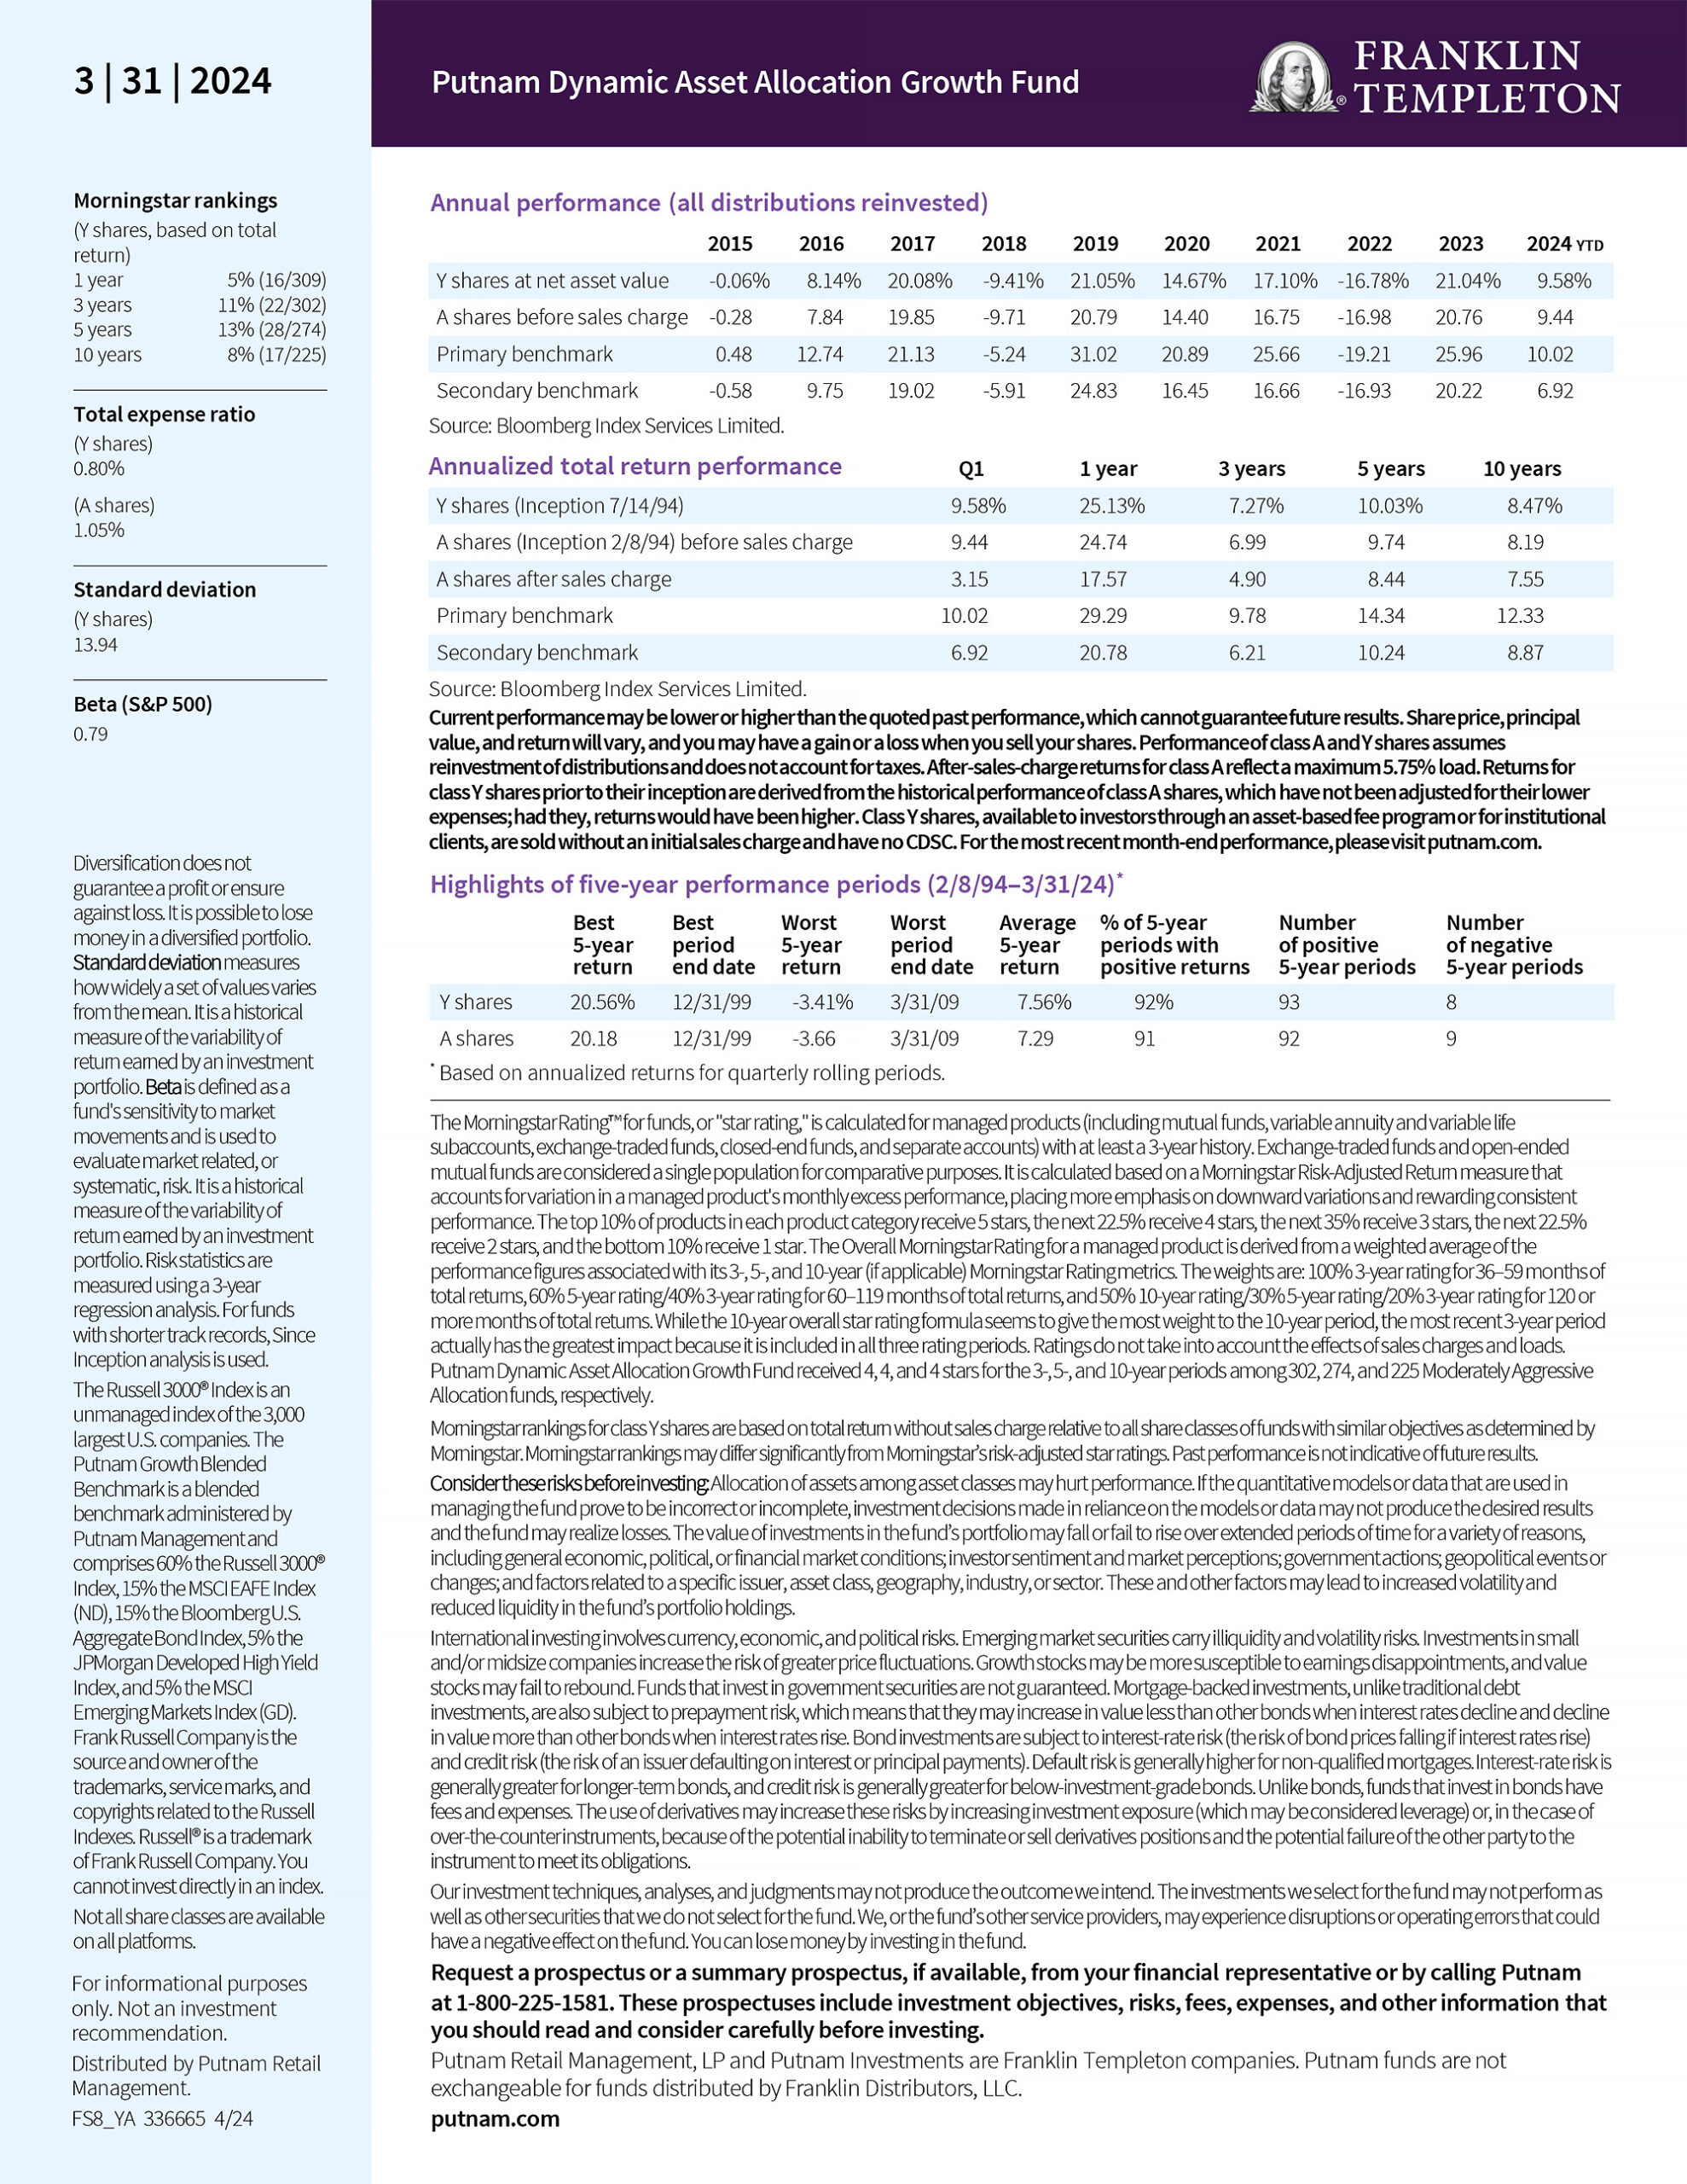
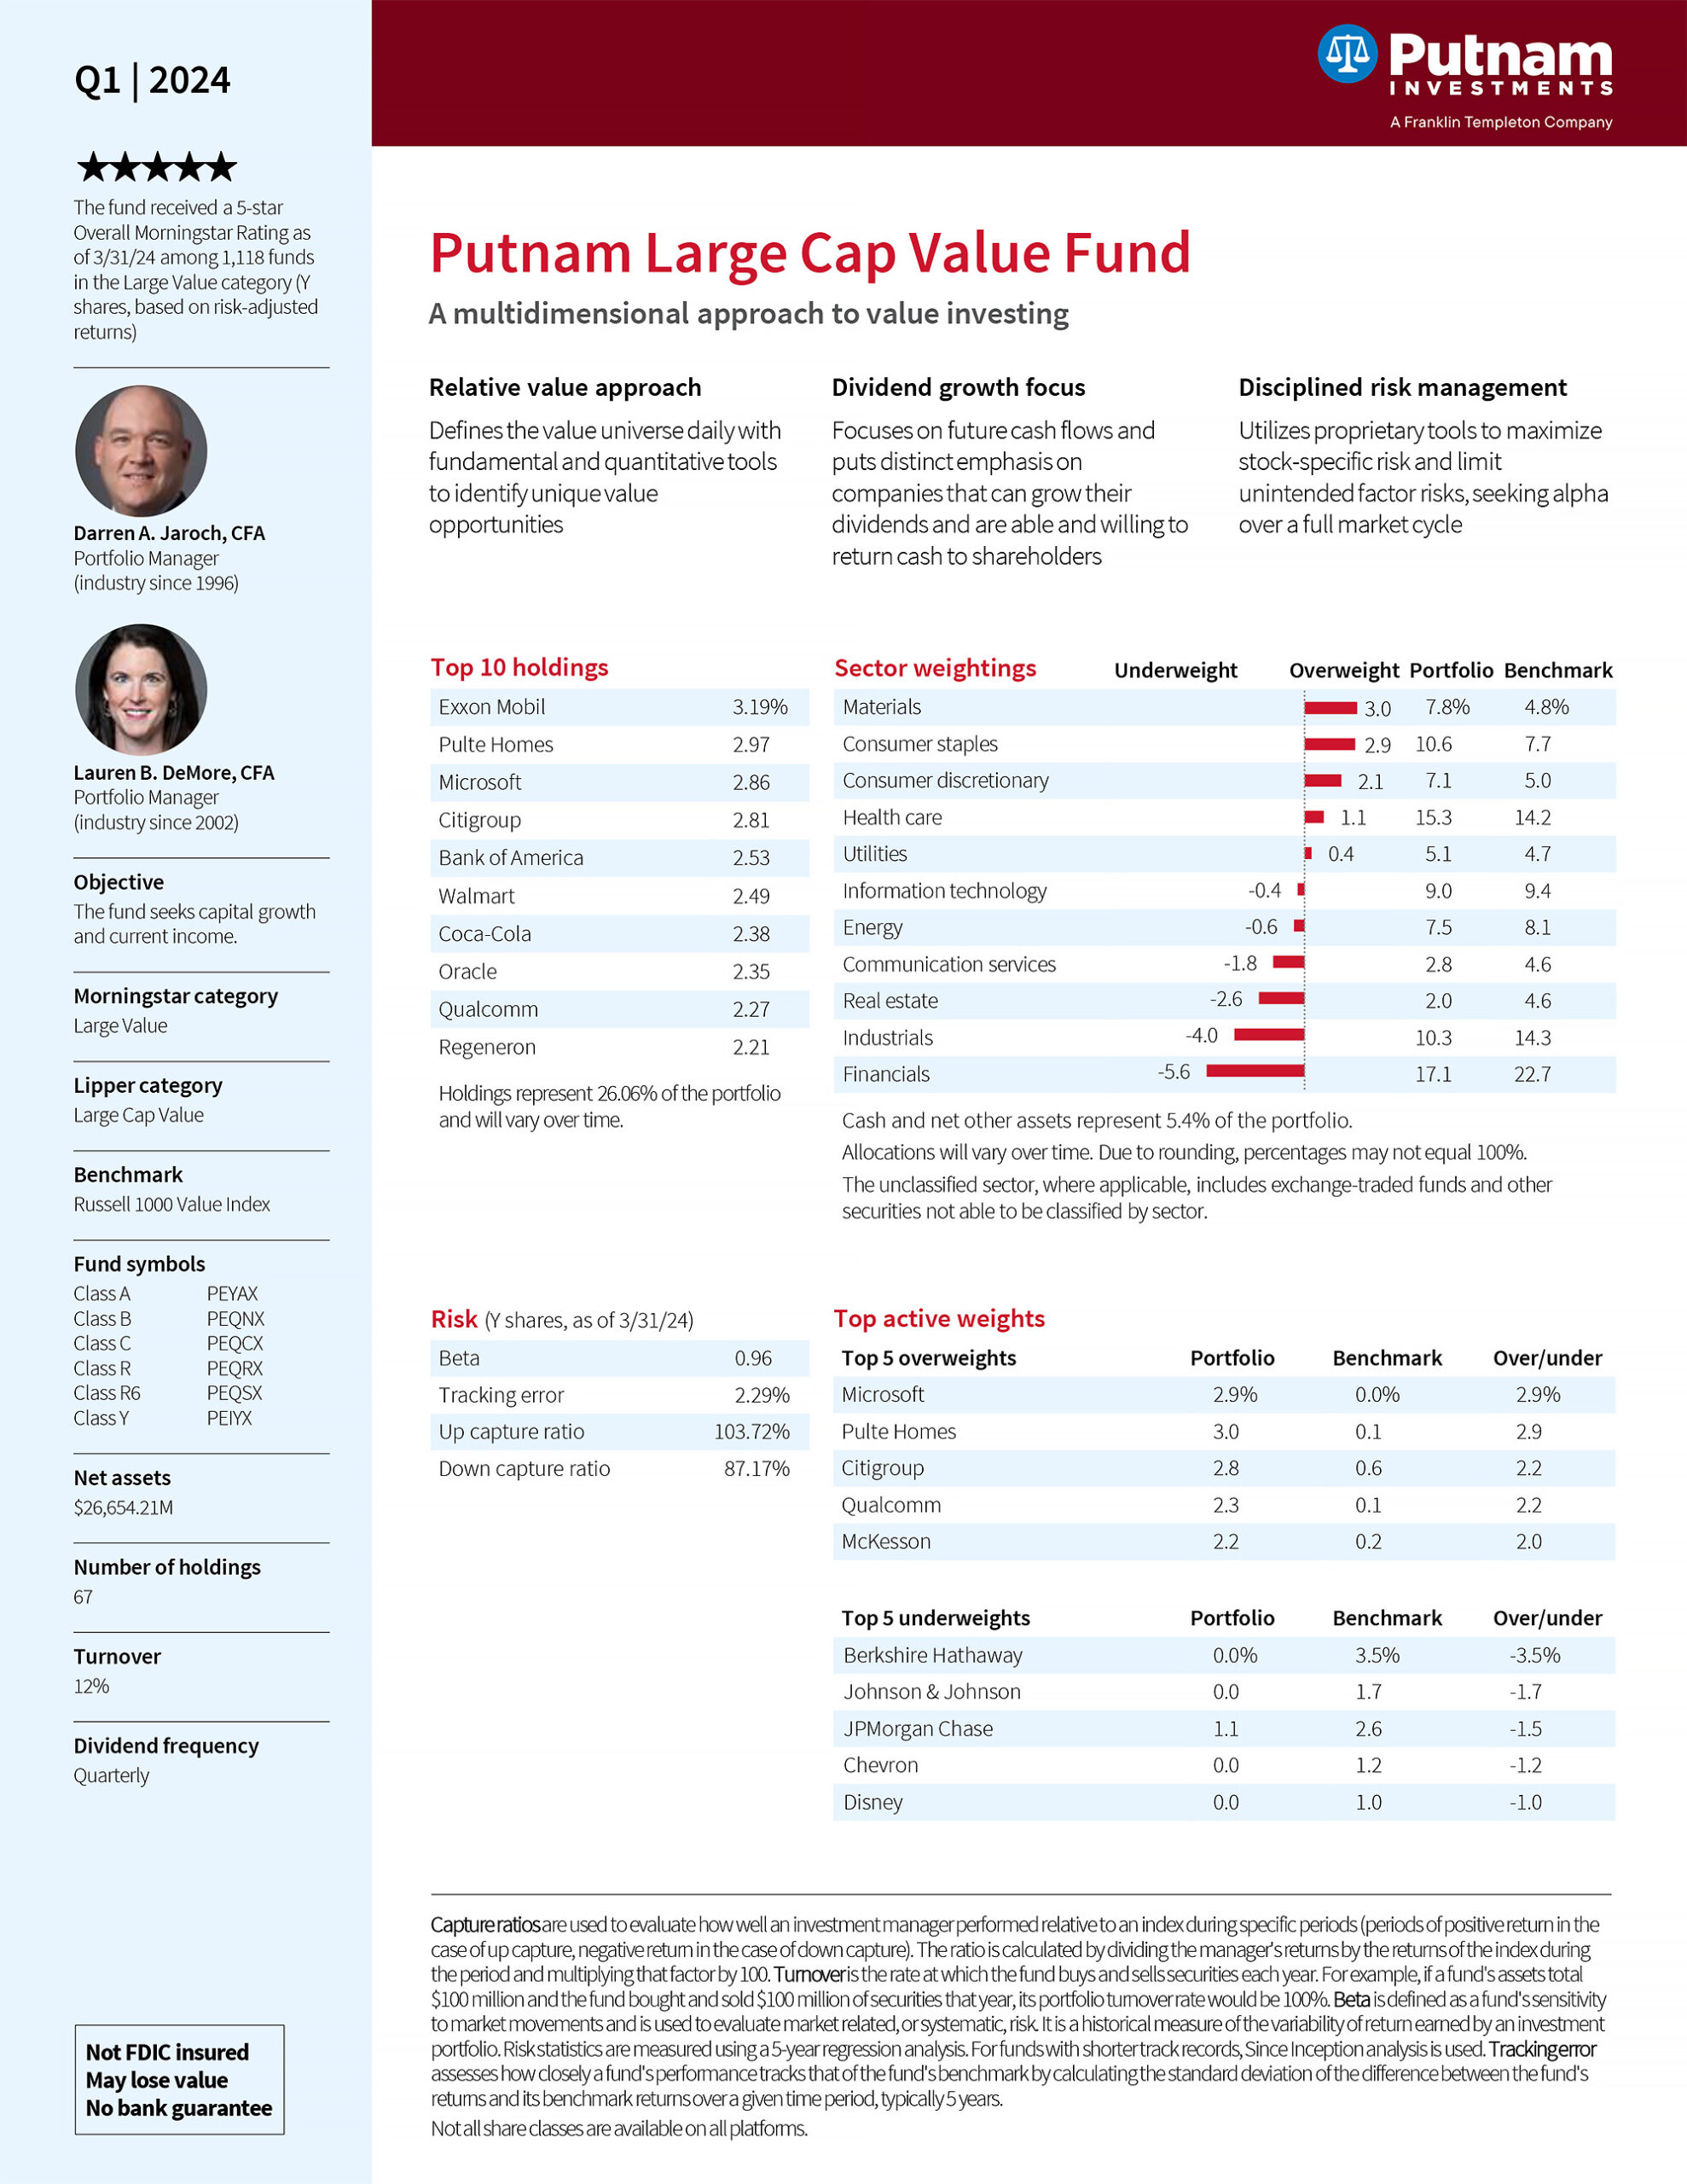
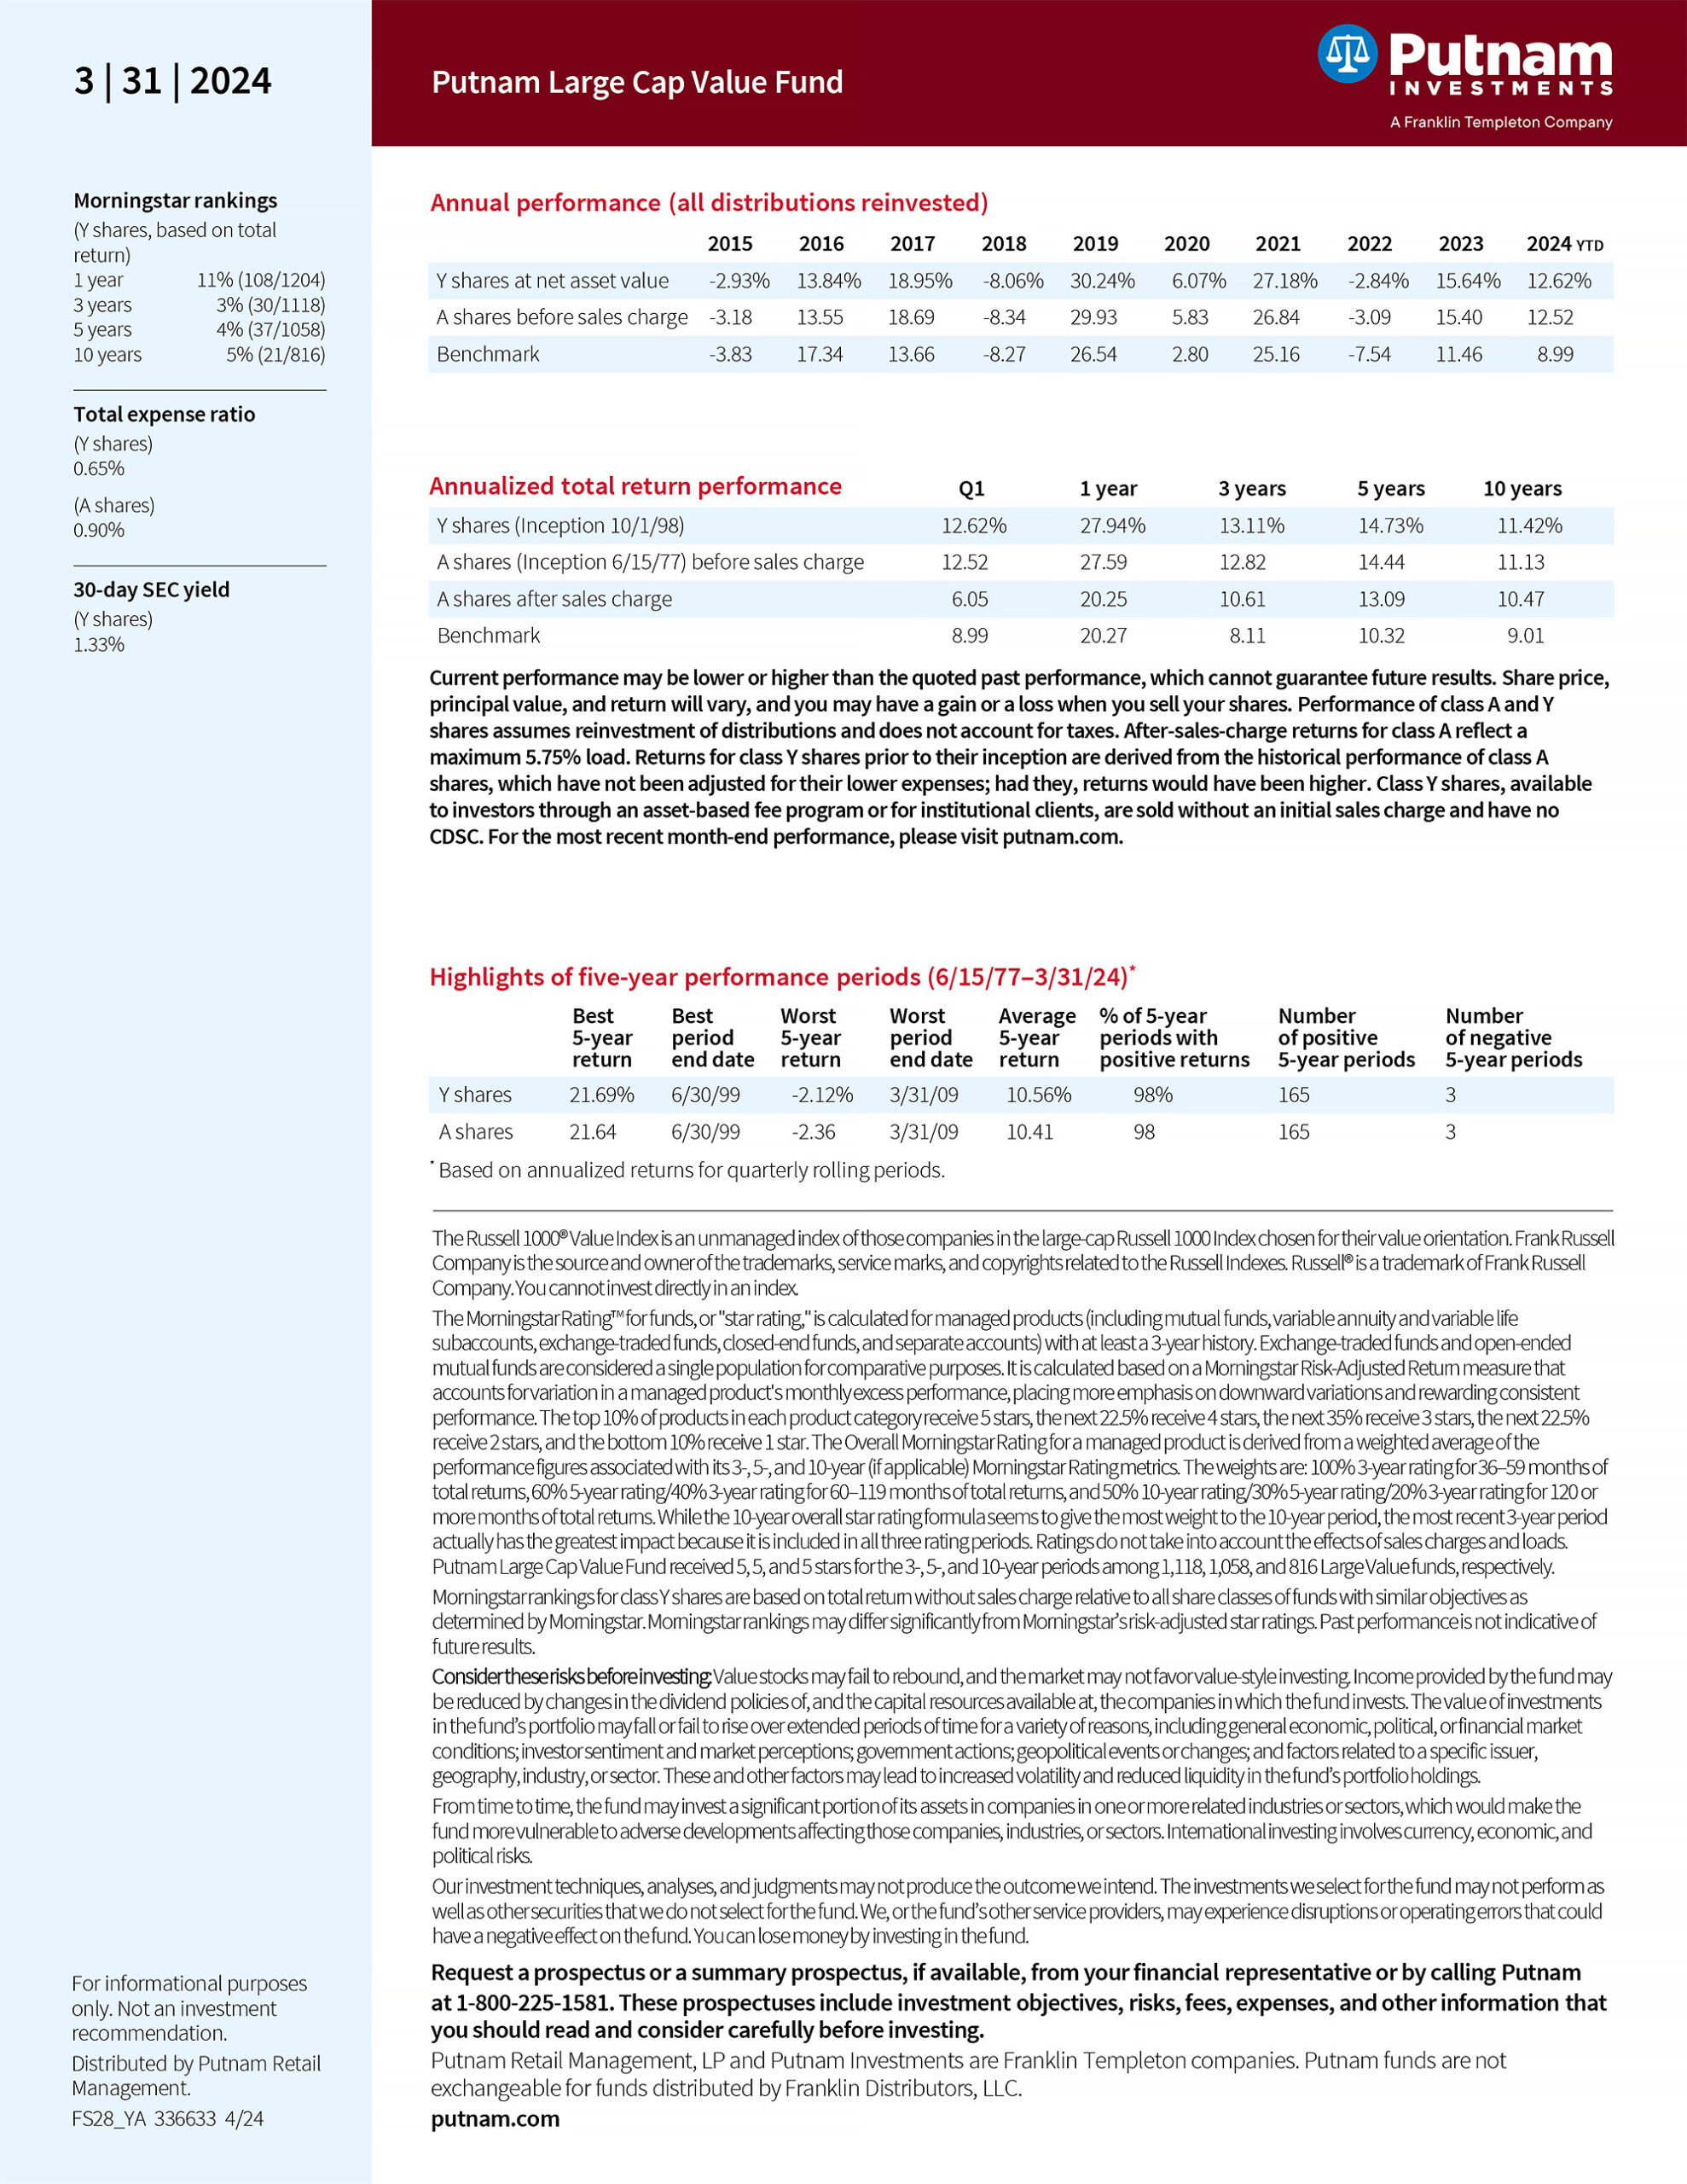
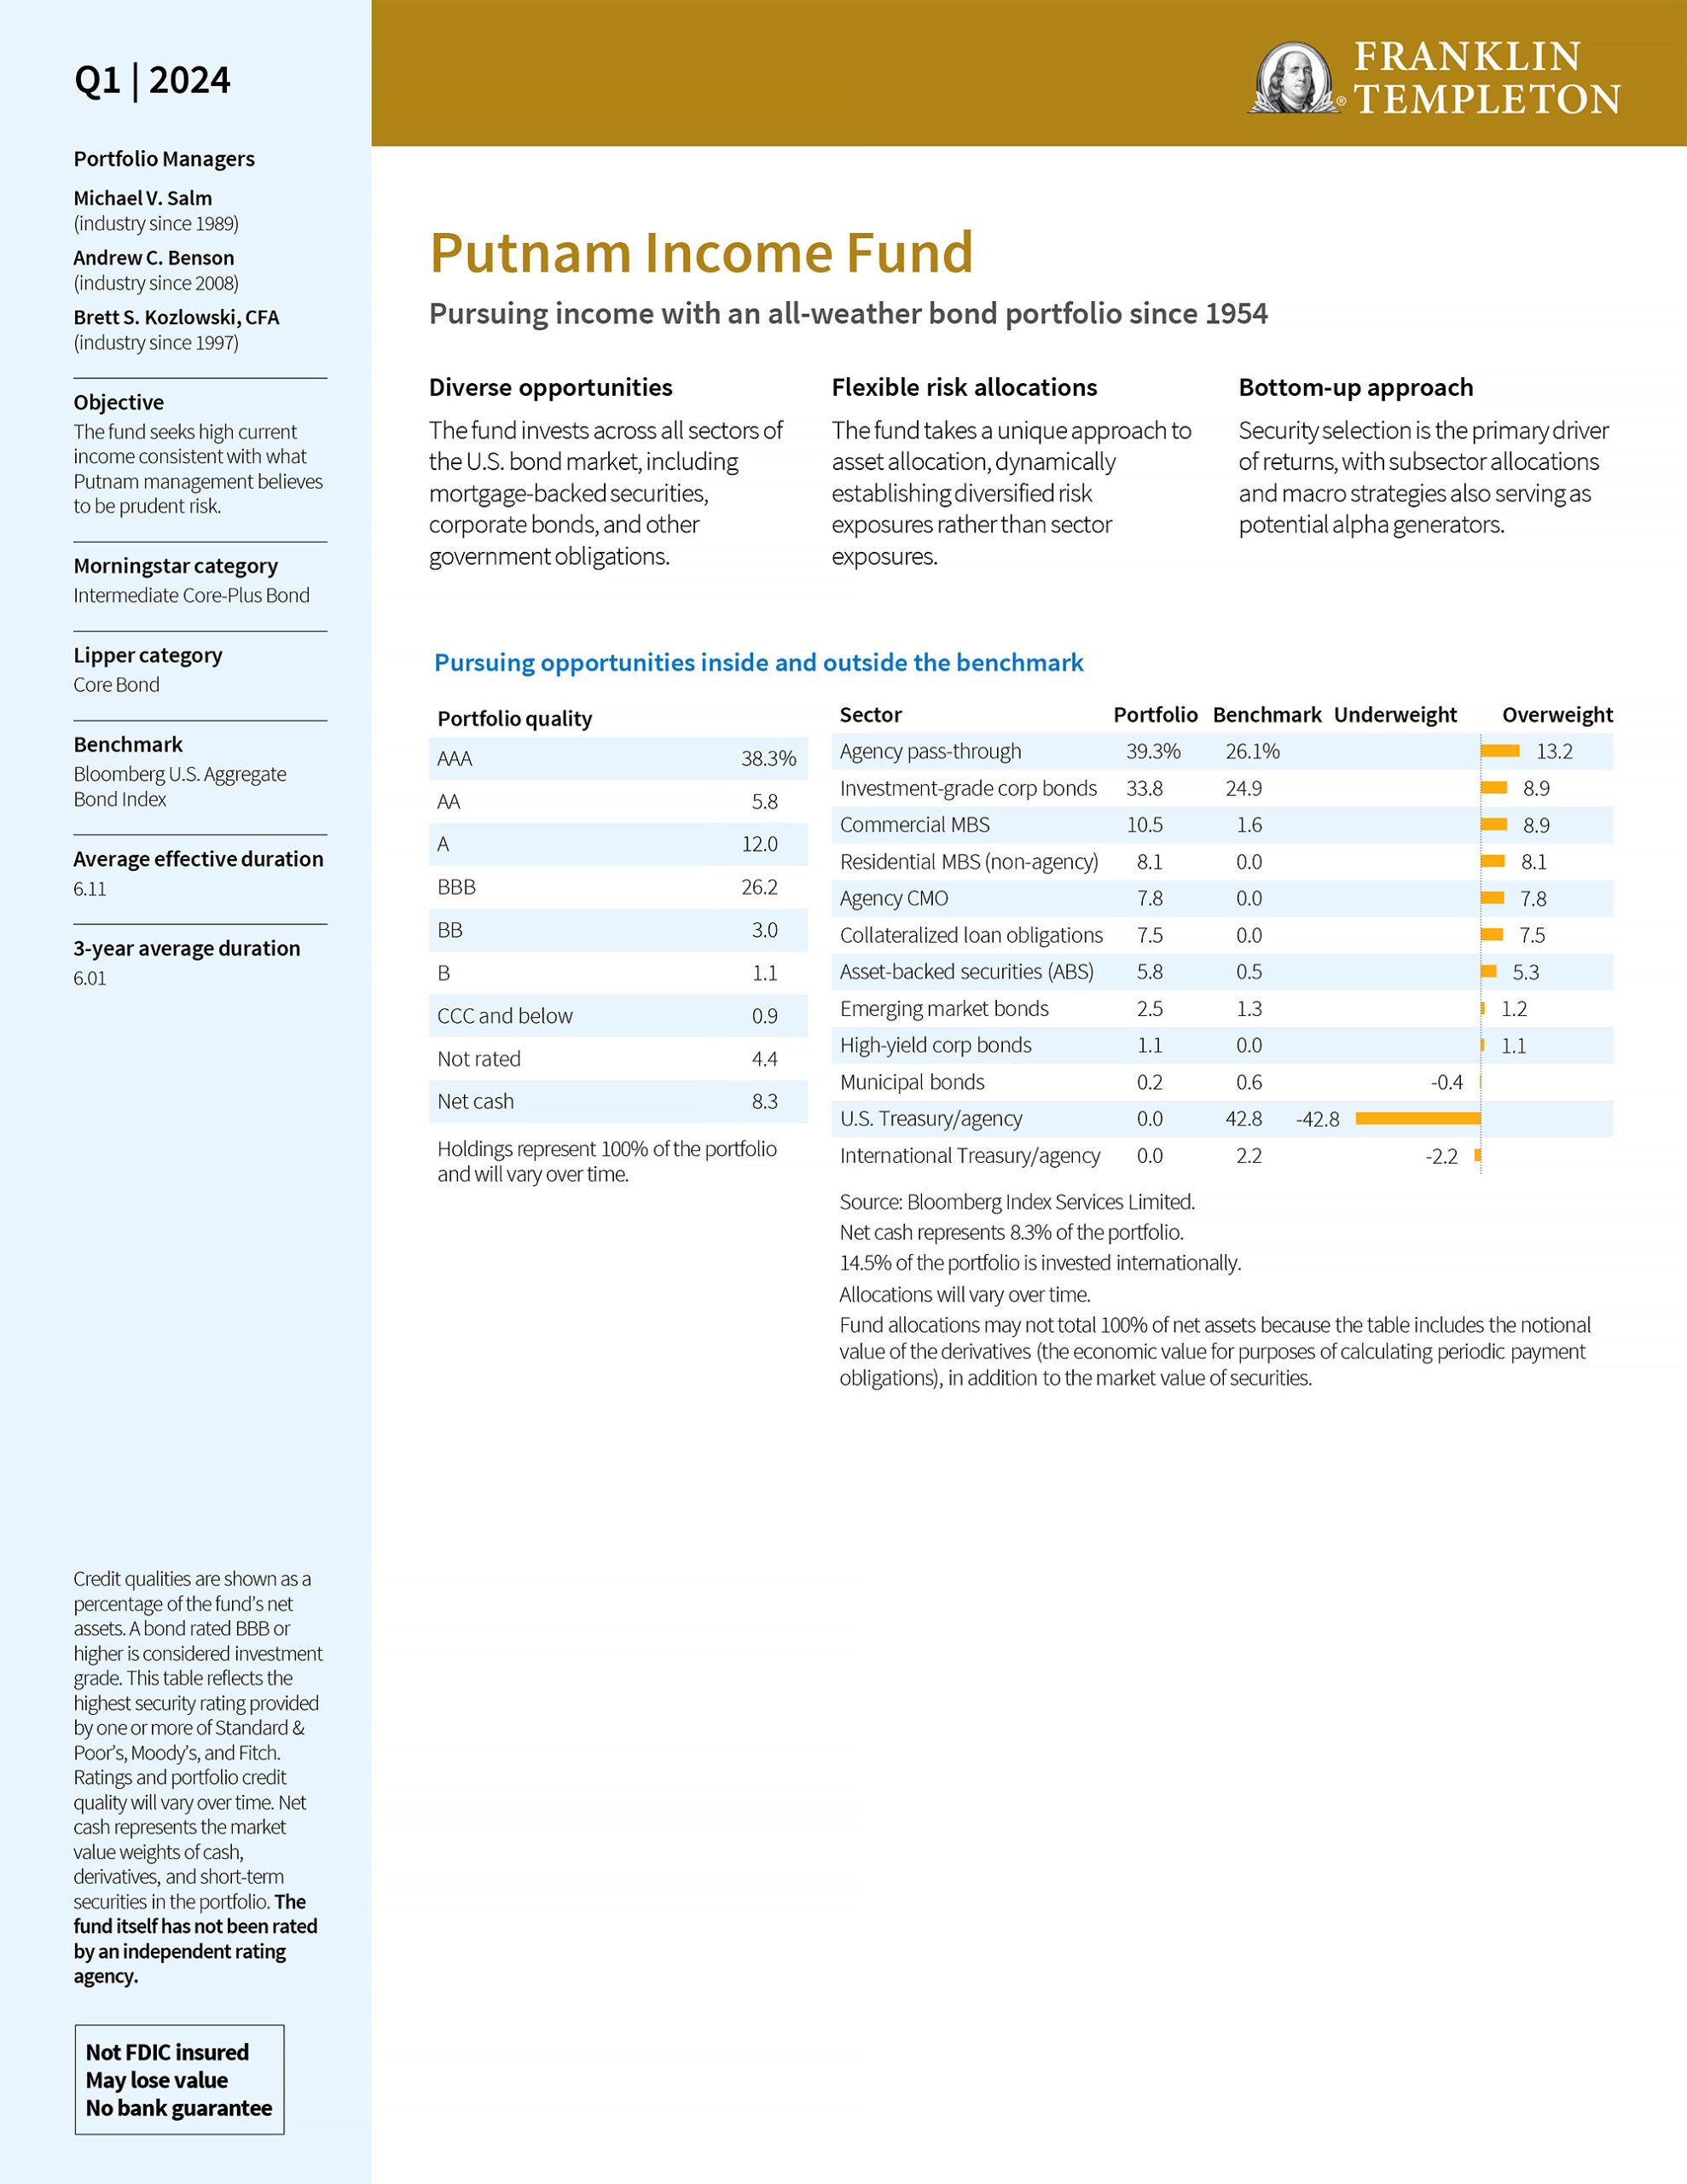
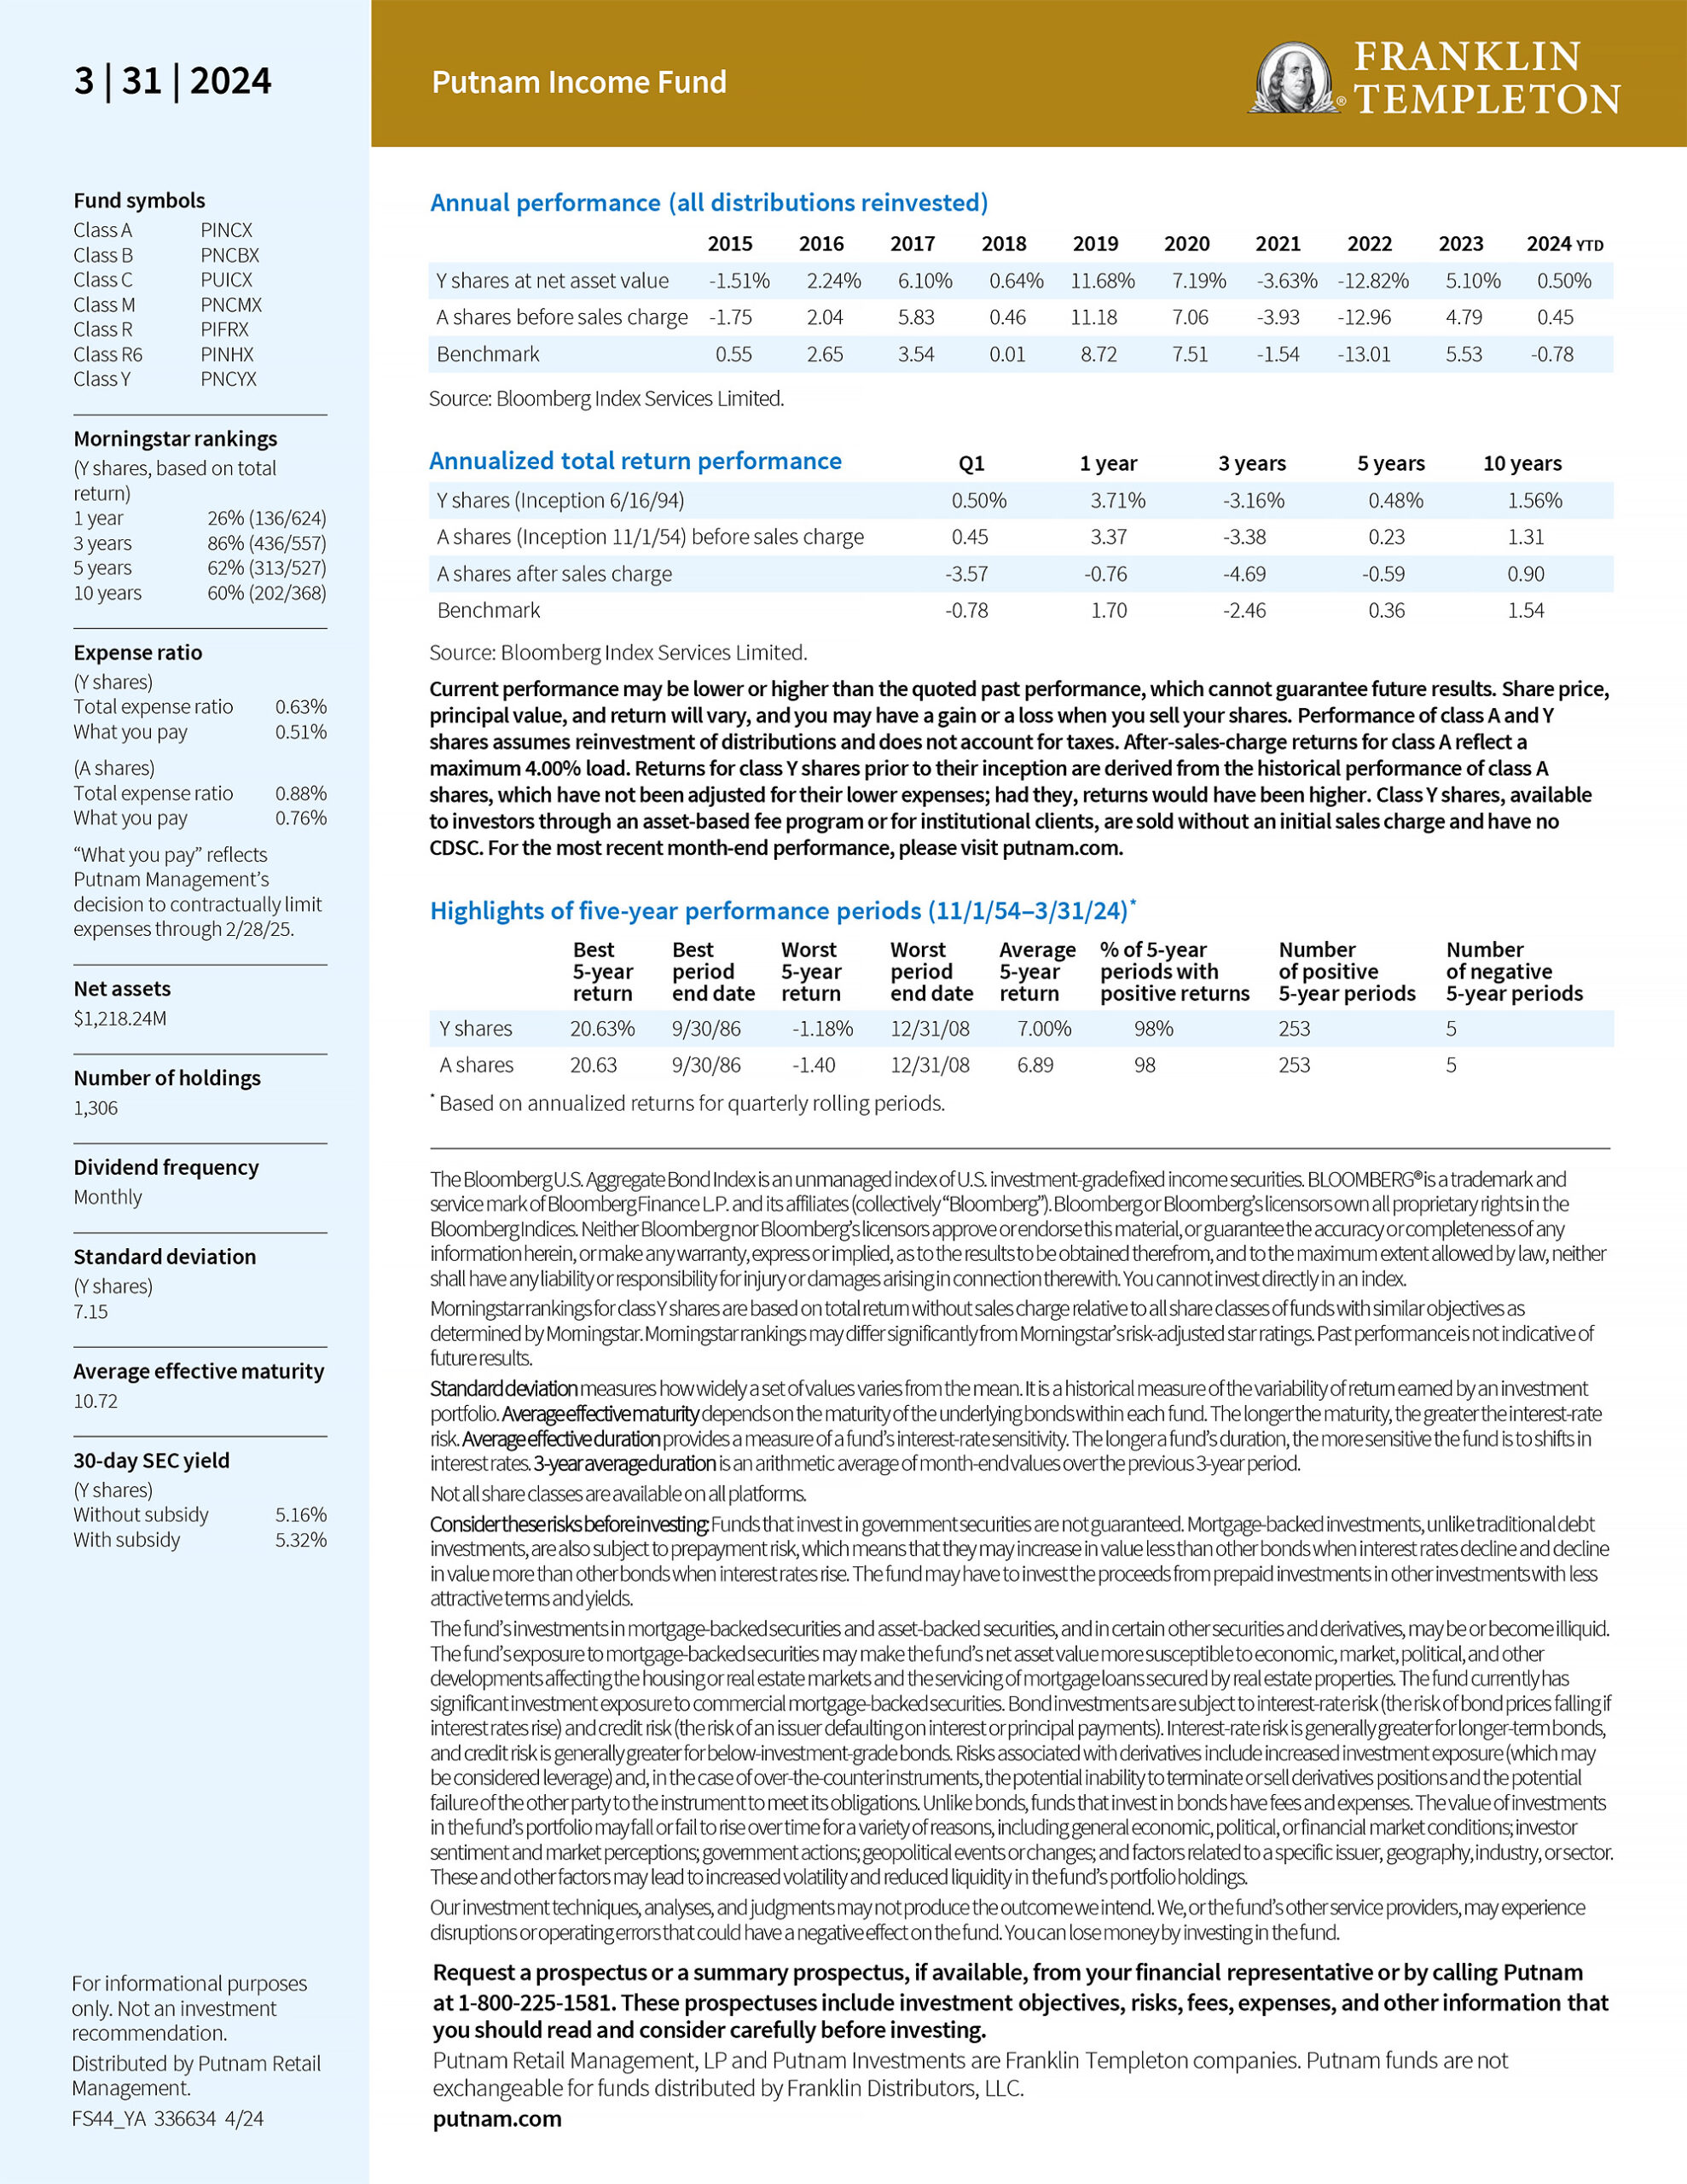
My main priority while a Presentation Designer at Putnam Investments (now Franklin Templeton) was the production of factsheets for over 100 financial products on a quarterly basis to be distributed both through print as well as digital use cases. The creative team at Putnam originally determined the overall design while my team handled the data automation required to render all of the factsheets in a very tight timeline for reporting requirements. The process used Seismic (an enablement software platform) to populate all the data into PowerPoint templates laid out to accommodate all required components. We handled all the changes requiring redesigning the templates while staying within the design guidelines. The data was sourced from different databases, spreadsheets, departments and firms. Components were created to retrieve the required data and formatted to fit within the template. Each financial product had different reporting requirements and therefore required different templates, components, tables, and charts. At last count, this meant our team oversaw a total of 25 different templates to be able to efficiently produce all the factsheets each quarter. This number changed based on new products being introduced by the firm.